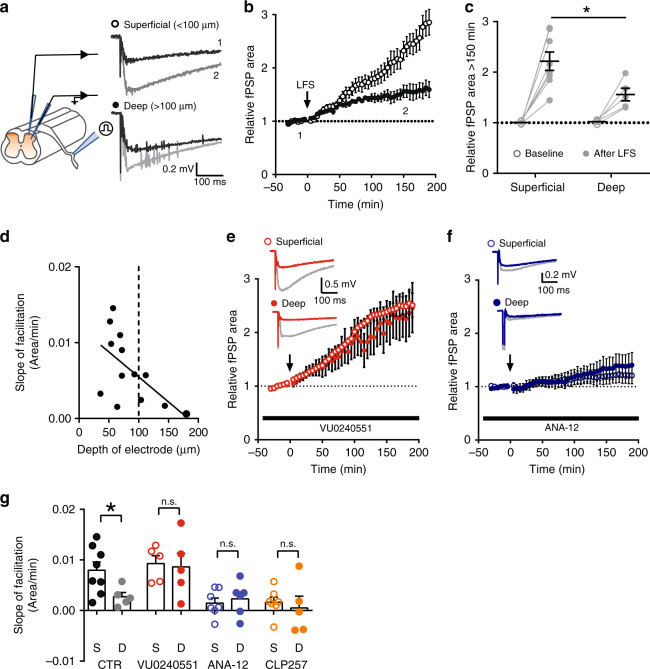
Fig. 7. KCC2 levels shape synaptic plasticity across the superficial dorsal horn.
a Schematic representation of the experimental procedure (left). Field responses were evoked by dorsal root stimulation and recorded at different depths from the dorsal surface (right). Baseline responses (black) were facilitated after low-frequency stimulation (LFS; gray). b Time course of fPSP responses in superficial (n = 8) and deep recordings (n = 5). Arrow shows the time of LFS application. Number insets correspond to baseline and facilitated traces in a. c LFS produced a greater increase in fPSP responses in superficial than in deep recordings after 150 min (t= 2.6, P = 0.02). Individual experiments are depicted in gray. d Relationship between the rate of fPSP area increase (slope of LTF) and the distance of the recording electrode position from the external dorsal horn surface. The slope of LTF decreases as the recording electrode is placed deeper into the dorsal horn. e Blocking KCC2 activity with VU0240551 (10 μM) produced similar increase in fPSP responses after LFS in superficial (n = 5) and deep recordings (n = 5). Insets show representative traces of fPSP responses during baseline (red) and 150 min after LFS (gray). f LTF was stabilized in superficial recordings (n = 7), similar to deep (n = 6), when TrkB signaling was blocked with ANA-12 (1 μM). Insets show representative traces of fPSP responses during baseline (blue) and 150 min after LFS (gray). g Differences in slope of LTF between superficial (black) and deep (gray) recordings. VU0240551 (red) abolished the difference in slope of LTF between superficial and deeper recordings (unpaired t-test, t = 0.2, P = 0.8), while ANA-12 (blue) or CLP257 (5 μM, orange) treatments stabilized the slope of LTF in superficial recordings (ANA-12: t = 0.5, P = 0.6; CLP257: t = 0.5, P = 0.6). CTR control, fPSP field post-synaptic potential, LFS low frequency stimulation, LTF long-term facilitation. S superficial, D deep, n.s. not significant. Data are shown as mean ± S.E.M. *P < 0.05.

