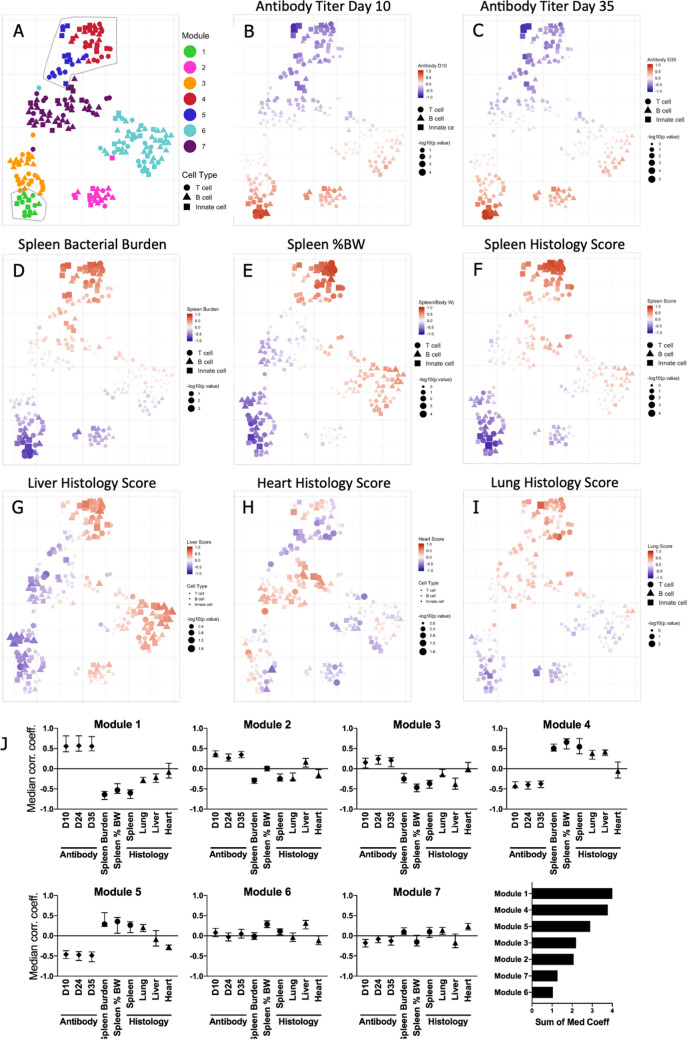
Figure 4.
Correlation of clusters to measures of vaccination and infection. For matched clusters from tgHLA-DR3 mice, the correlation to measures of vaccination (antibody titer) and infection (spleen bacterial burden, spleen %BW, and histology scores) was determined (Supp Fig. 5). Correlation matrix data were used to generate a t-SNE map. T cell, B cell, and innate clusters are denoted by distinct shapes. (A) The hierarchical structure of the correlation matrix was used to identify 7 modules (Suppl Fig. 5), and each module was color-coded to indicate its position on the t-SNE. The outlined areas indicate the modules with the highest median correlation coefficient for clinical measures within the matrix (Module 1 lower left, Modules 4 and 5 upper right). (B–I) For each cluster, symbol size indicates correlation p-value while color is function of the correlation coefficient to the antibody titer on Day 10 and 35 post-vaccination (B,C), or measures of infection (D–I). (J) Individual panels show the median correlation coefficient for each clinical measure for each module. In the lower right graph, modules are ranked based on the sum of the median correlation coefficients.

