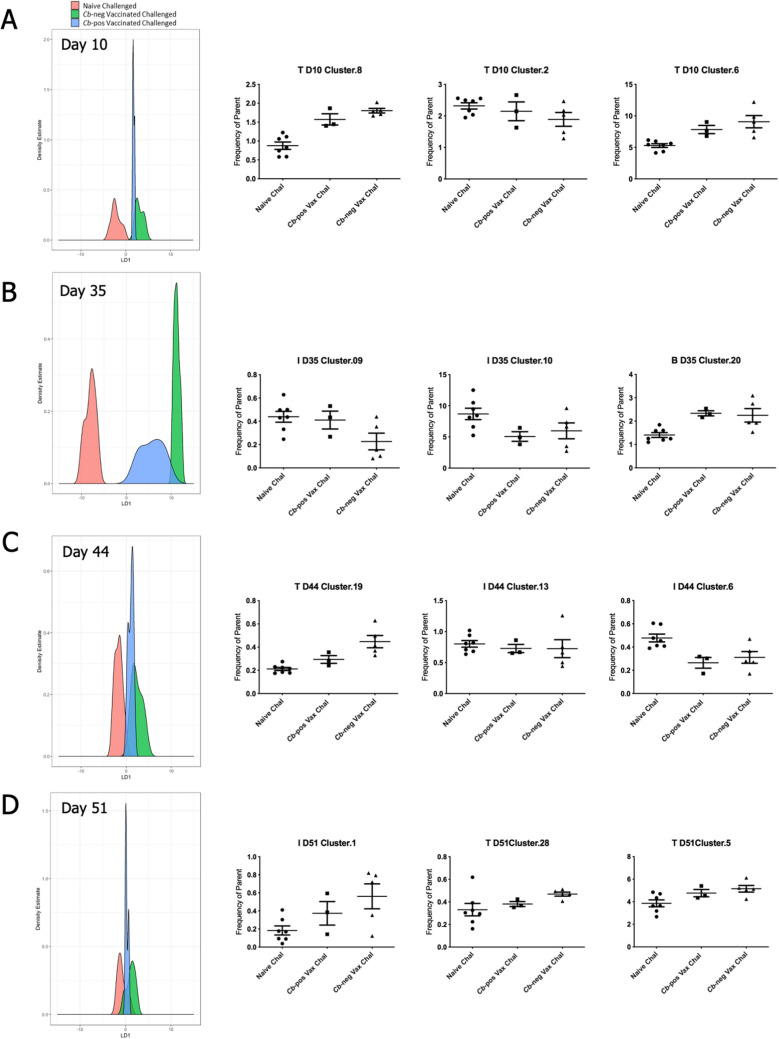
Figure 6.
Identification of features characterizing vaccine efficacy following challenge. Linear discriminant analysis (LDA) models were constructed for each timepoint to rank combinations of up to 3 clusters based on the ability to distinguish naïve challenged mice (N = 7) from Cb-neg vaccinated challenged mice (N = 5) and subsequently assess the distribution of Cb-pos mice (N = 3). The discriminant functions with high predictive accuracy were used to project the three groups onto corresponding feature space and identify combinations of cell populations where the Cb-pos mice trend towards the naïve vaccinated mice. LDA plots depict the distribution of each group, where the center of the x-axis denotes the point where the naïve challenged and Cb-neg vaccinated challenged groups are maximally separated and the y-axis reflects the count (or density estimate). Adjacent to each LDA plot is a scatter plot for the respective constituents. The title of each plot indicates the cluster identity and the frequency parent on the y-axis.

