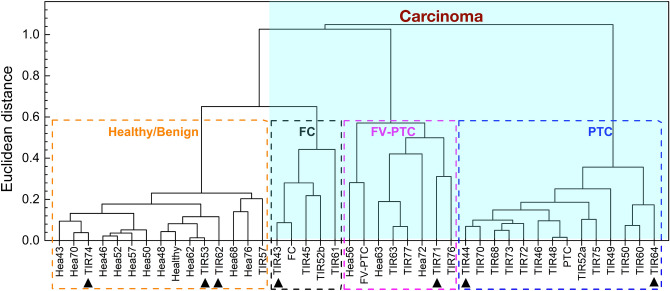
Figure 2.
Agglomerative hierarchical clustering analysis. Dendrogram of the Raman spectra of human thyroid tissues, as extracted from the AHCA analysis. Individual samples are represented by the label Hea (for healthy), or TIR (for not healthy) followed by the patient anonymous ID code. Those plotted in Fig. 1A are labelled healthy, FC, FV-PTC and PTC, respectively. Dashed squares identify the four clusters, namely healthy/benign (orange), Follicular carcinoma or FC (black), follicular variant of papillary carcinoma or FV-PTC (magenta) and papillary carcinoma or PTC (blue). The arrows indicate the adenoma samples. All samples within the light blue shaded area are carcinomas.

