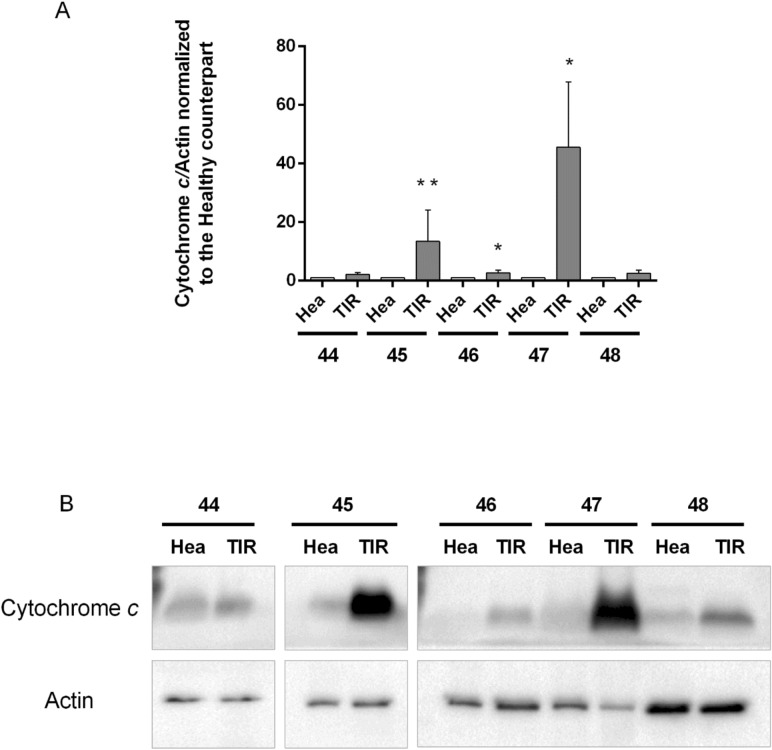
Figure 5.
Biochemical analysis. Expression levels of cytochrome c have been assessed in thyroids of five patients; for each patient, the healthy (Hea) and pathological (TIR) slices have been analysed. (A) Levels of cytochrome c have been normalized to actin. Data represent the mean values ± SDs derived from three replicates normalized to healthy counterparts (Student’s t test, *P < 0.05, **P < 0.01 compared with control). (B) Exemplificative images of filters blotted with cytochrome c and actin primary antibodies. Images have been gathered at the same time.

