Figure 6.

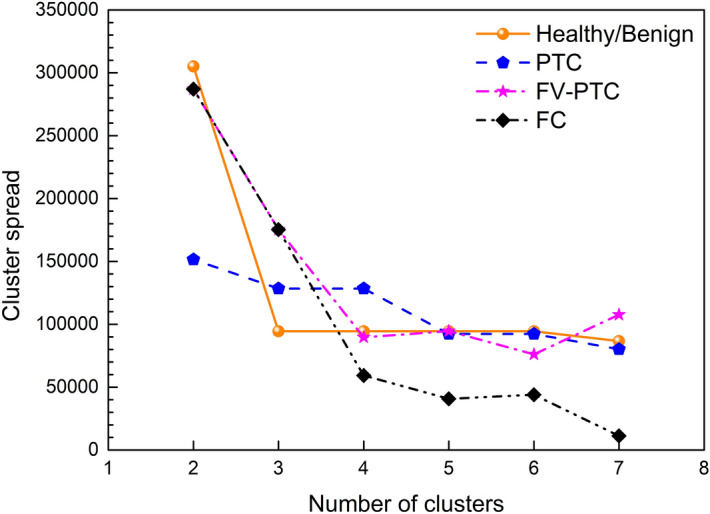
Spread of the individual K-means clusters as a function of their number. Data are reported by using the same colors as in Fig. 2 for the individual clusters. Notice that four clusters give the largest spread among the clusters.

Spread of the individual K-means clusters as a function of their number. Data are reported by using the same colors as in Fig. 2 for the individual clusters. Notice that four clusters give the largest spread among the clusters.