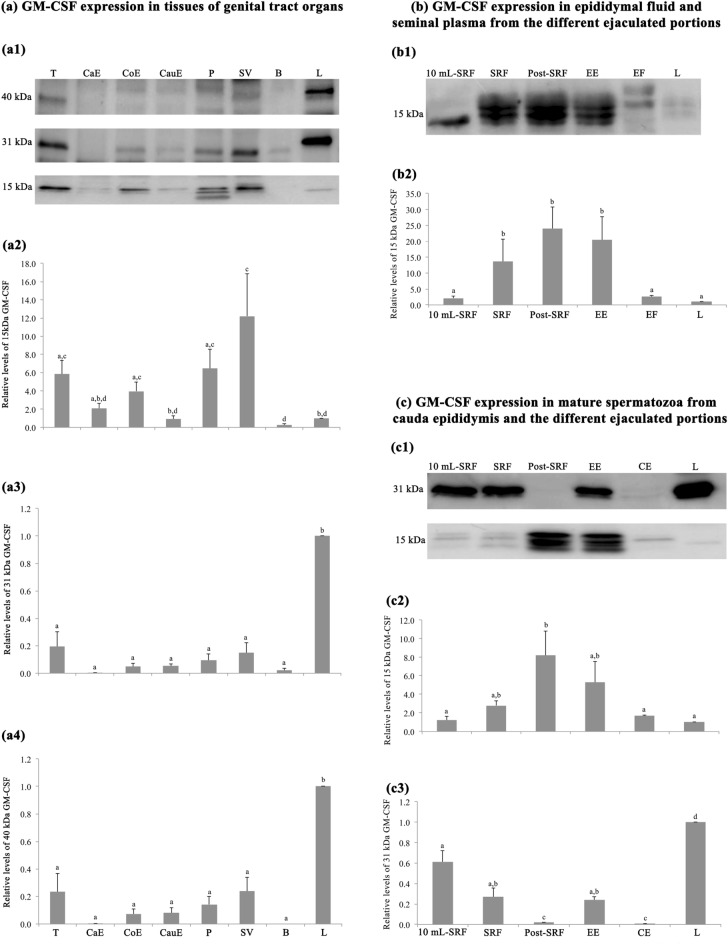
Figure 6.
Western blot analysis and relative quantification of GM-CSF expression in porcine genital tract, epididymal fluid (EF), seminal plasma (SP) and in spermatozoa from cauda epididymis (CE) and different ejaculate portions. In (a1), three bands of GM-CSF expression with the different glycosylation degrees: 15, 31 and 40 kDa. In (a2–a4), the relative quantity of 15 kDa (a2), 31 kDa (a3) and 40 kDa (a4) in reproductive tissues; T: testes. CaE: caput epididymis. CoE: corpus epididymis. CauE: cauda epididymis. P: prostate. SV: seminal vesicle. B: bulbourethral gland. In (b1) one band of active GM-CSF expression of 15 kDa. In (b2) relative quantity of 15 kDa in EF and SP from the different ejaculate portions: first 10 mL-SRF, rest of SRF, post-SRF, entire ejaculate (EE). (c1) Two bands of active and glycosylated GM-CSF of 15 and 31 kDa. (c2 and c3) Relative quantity of 15 kDa (c2) and 31 kDa (c3) in mature spermatozoa from CE, first 10 mL-SRF, rest of SRF, post-SRF and EE. L: expression in liver tissue, as control. a–d Indicate relative quantitative differences (p < 0.05) among tissues, fluid and sperm sources. SRF: sperm-rich fraction. Cropped image of Western blot (see Supplemental Information, Fig S6 for full image).

