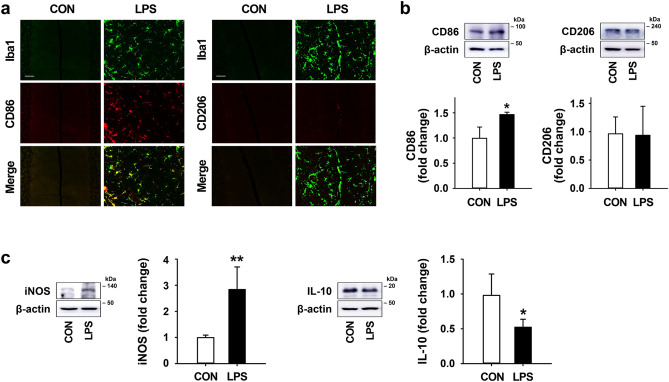
Figure 3.
Effects of LPS on microglial polarization in the mouse cerebellum. (a) The expression pattern of microglia (Iba1; green) and M1/M2-type microglia marker (CD86 and CD206; red) in the cerebellum 7 days after LPS treatment (Scale bar = 50 μm). (b) The expression levels of CD86 and CD206 in the cerebellum at 7 days post-LPS injection. CD86: *p = 0.038 versus CON, F(4,10) = 10.512). (c) The expression levels of iNOS (for M1 marker) and IL-10 (for M2 marker) in the cerebellum 7 days after LPS treatment. iNOS: **p = 0.007 vs. CON (n = 4 per group, F(3,12) = 10.207). IL-10: *p = 0.022 versus CON (n = 4 per group, F(3,12) = 25.728). All values are expressed as the mean ± standard deviation (SD). Statistical significance tested with one-way ANOVA with Tukey’s post-hoc analysis. The membranes were initially cut according to the molecular weight size of proteins. The images of blots were displayed in cropped format, and original blots of (b) and (c) with cropped demarcation of membranes are shown in Supplementary Fig. 2.

