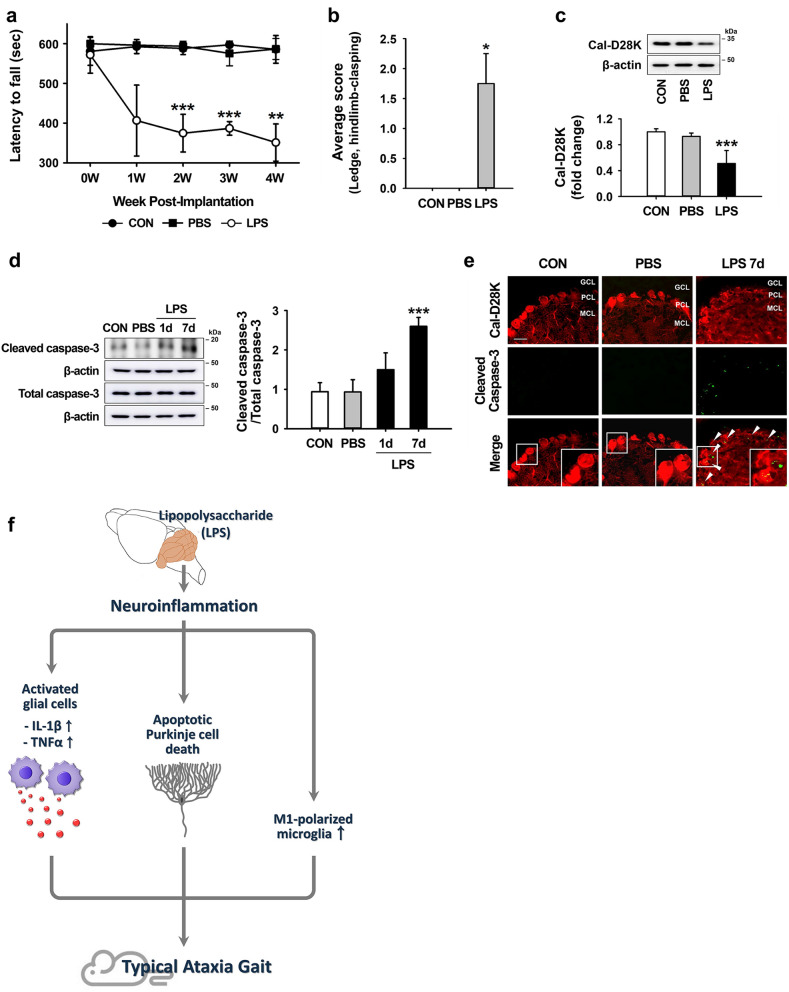
Figure 4.
Behavioral impairment and apoptotic Purkinje cell death induced by inflammation in LPS-injected mice. (a) Rotarod test for 4 weeks after LPS injection. **p = 0.001 and ***p < 0.001 versus CON (CON, n = 6; PBS, n = 4; LPS, n = 3; 2 W, t(5) = 8.316; 3 W, t(5) = 21.243; 4 W, t(5) = 6.690). (b) Simple composite phenotype scoring system at 4 weeks post-LPS injection. *p = 0.029 versus CON (n = 4 per group). (c) The expression levels of Cal-D28K (for Purkinje cells) in the cerebellum 7 days after LPS injection. ***p < 0.001 versus CON (n = 4 per group, F(3,12) = 14.735) (d) The expression levels of activated caspase-3 in the cerebellum 7 days after LPS injection. ***p < 0.001 versus CON (n = 4 per group, F(3,12) = 25.842). All values are expressed as the mean ± standard deviation (SD). Statistical significance tested with two-sided paired t-test (a), Mann–Whitney U statistic (b), and one-way ANOVA with Tukey’s post-hoc analysis (c and d). (e) Detection of apoptotic Purkinje cells (arrowheads) in the cerebellum 7 days after LPS injection, using immunofluorescence analysis of cleaved caspase-3. We use “MCL” to represent the molecular cell layer, “PCL” to represent the Purkinje cell layer, and “GCL” to represent the granule cell layer. Insets delimited by the solid line in the panels on the right show high magnification portions of the image. (Scale bar = 100 μm). (f) Schematic representation of ataxia symptoms induced by neuroinflammation in the LPS-exposed cerebellum. The membranes were initially cut according to the molecular weight size of proteins. The images of blots were displayed in cropped format, and original blots of (c) and (d) with cropped demarcation of membranes are shown in Supplementary Fig. 2.

