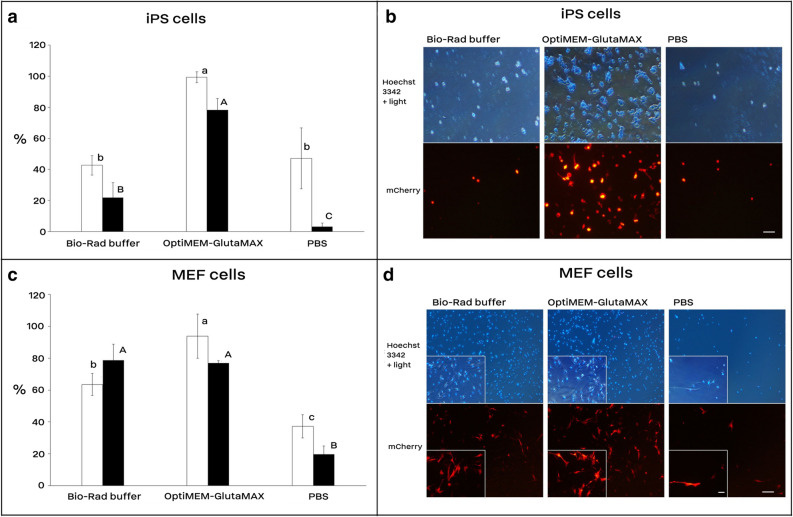
Figure 1.
Cell electrotransfection and viability rates using Bio-Rad buffer, OptiMEM-GlutaMAX, and PBS. Electrotransfection efficiency of mouse iPS (a and b) and MEF cells (c and d). In each electroporation reaction, 20 µg (1.5–2.5 µg/µl) of the reporter plasmid (encoding mCherry) was pre-mixed with cells and underwent electroporation using the square-wave protocol consisted of 250 V for iPS and 300 V for MEF cells, 2 pulses, each 10 ms length, 10 s interval, and 4 mm cuvette. The reporter expression was assessed 36 h after electroporation under a fluorescence microscope. White and black bars are electrotransfection efficiency and cell viability, respectively. Bars with different A, B, C or a, b, c letters are significantly different (p value < 0.05). Scale bar is 100 µm; for MEF cells, a higher magnified photo is indented in the left part of each image with a scale bar of 5 µm. Results are means and standard deviation (n > 3).

