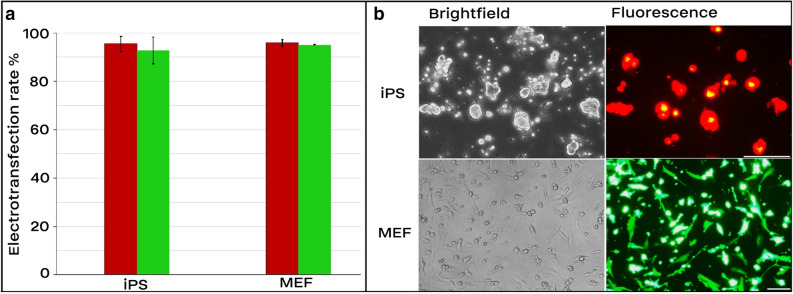
Figure 2.
Electrotransfection efficiency of MEF and iPS cells. In each electroporation reaction, 20 µg (1.5–2.5 µg/µl) of either pT2-Venus and pT2-mCherry which encode Venus and mCherry proteins, respectively, were pre-mixed with cells and underwent electroporation. The following electroporation program was used: square-wave protocol with either 250 V for iPS or 300 V for MEF cells, each 10 ms pulse length, 2 pulses, 10 s pulse interval, and 4 mm cuvette. (a) Transfection efficiency. Transfected cells for mCherry and Venus are depicted by red and green bars, respectively. (b) Expression of Venus and mCherry 36 h after electroporation. Scale bar for iPS cells equals 100 µm. Scale Bar in fibroblasts is 10 µm. Results are means and standard deviation (n > 3).

