
Figure 1.
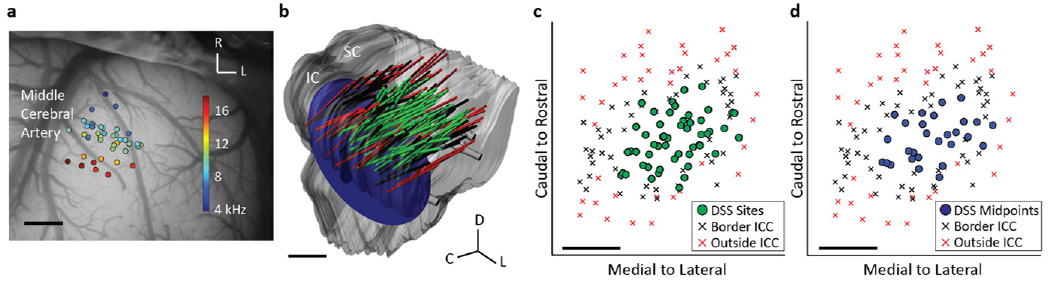
(a) The A1 recording locations, overlaid on a typical guinea pig cortex, with color representing the BF for each location averaged across layers I–V. Only sites that were BF-matched to ICC pairs were included and analyzed. (b) The midbrain and array placements were reconstructed in three dimensions and normalized onto a single brain. Green shanks correspond to ICC placements which were electrically stimulated (in pairs). Black and red shanks are placements on the border of or outside the ICC, as determined by FRMs along the shank (see Results). The 10 kHz isofrequency lamina was approximated by a plane at a depth which corresponds to neurons with 10 kHz BF, the average BF of the stimulated ICC sites. (c) The locations of the stimulated sites in the ICC were plotted along with the border and outside ICC sites across the 10 kHz lamina. (d) Analysis of the location effects across an ICC lamina was performed by determining the midpoint between each stimulated pair of ICC neurons. Scale bars are 1 mm. A1, primary auditory cortex; BF, best frequency; ICC, central nucleus of the inferior colliculus; SC, superior colliculus; IC, inferior colliculus; D, dorsal; C, caudal; L, lateral; R, rostral.