
Figure 8.
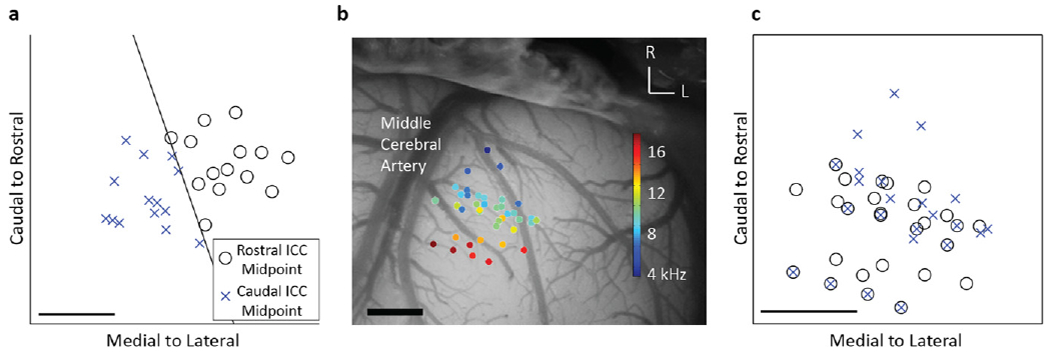
The ICC lamina was split into caudal–medial versus rostral–lateral regions (a) by the line perpendicular to the average steepest gradient axis, which is the average direction where cortical activity varies the most for the 0 and 0.5 ms IPI. The midpoint between each stimulation pair was determined to originate from one of those two regions. The A1 locations, overlaid on the cortex with BF values (b), recorded activity elicited from the caudal–medial region similar to those of the rostral–lateral region (c). The scale bars are 1 mm. Note that panels with A1 locations are boxed while ICC locations are open.