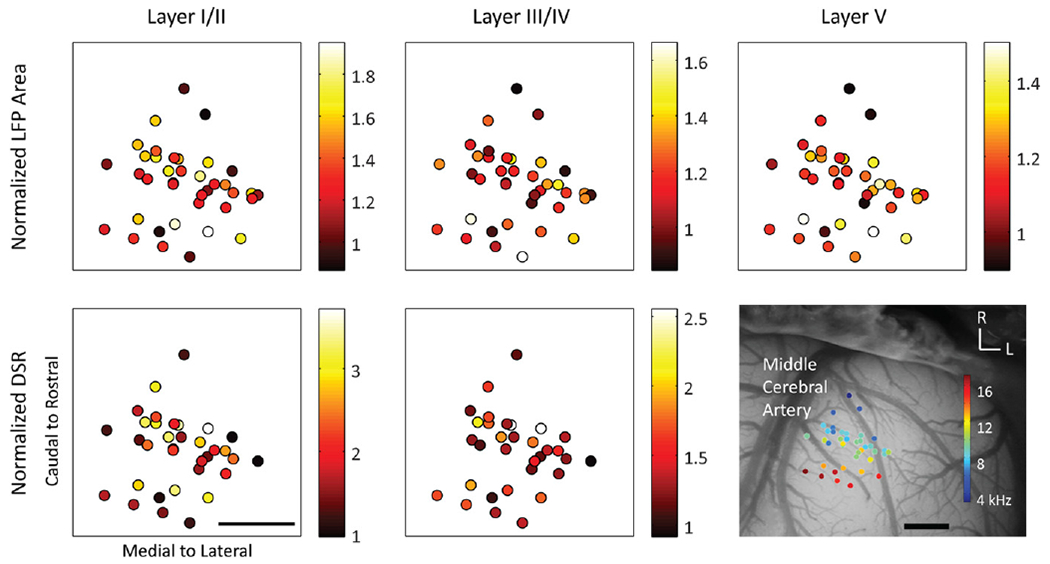
Figure 9.

The location of sites across A1 does not have a clear impact on the amount of normalized LFP area (top) or DSRs (bottom) recorded across different layers (columns). Indicated by color (no units), the normalized cortical activity for each location was averaged across stimulated locations in the ICC. The scale bars are 1 mm.
