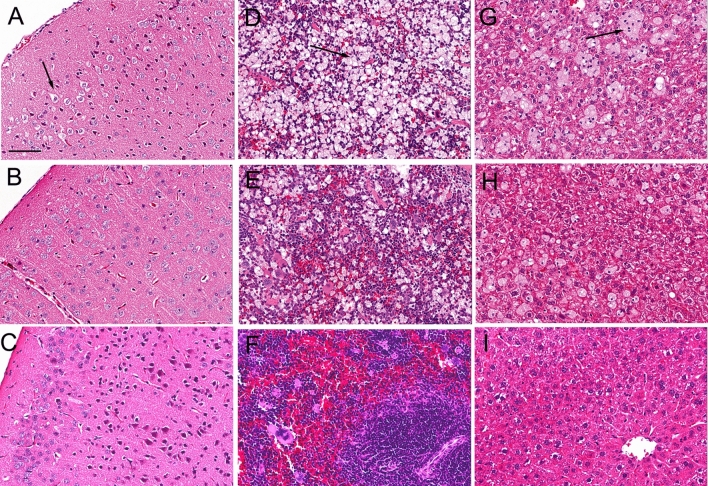
Figure 3.
H&E stains of cerebral cortex (A–C), spleen (D–F), and liver (G–I) from NPC1−/− mice or control mice at euthanasia. Panels (A, D, G) are NPC1−/− mice treated with vehicle; panels (B, E, H) are NPC−/− mice treated with TfRMAb/pPDGFB-NPC1 THLs. Panels (C, F, I) are control mice. Arrows in panels (A, D, G) point to cholesterol-laden cells in brain, spleen, and liver, respectively. Brain sections are through cortical layers I–IV. Magnification is the same for all panels and the panel A magnification bar = 100 microns.

