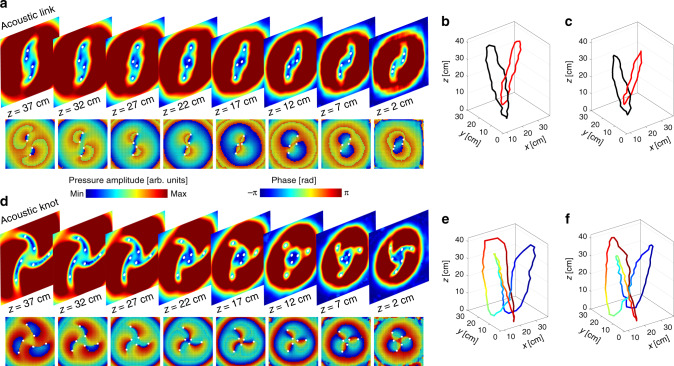
Fig. 3. The measured acoustic fields with Hopf link and trefoil knot vortex lines.
The left charts show the amplitude and phase distributions at different z-plane for a Hopf link and d trefoil knot. The white dots possessing the singular phase represent the vortices. The right charts plot the experimental Hopf link (b) and trefoil knot (e) as well as simulation ones (c, f), where the color marked on the vortex lines is used to distinguish the knotted structure with overlapped regions.

