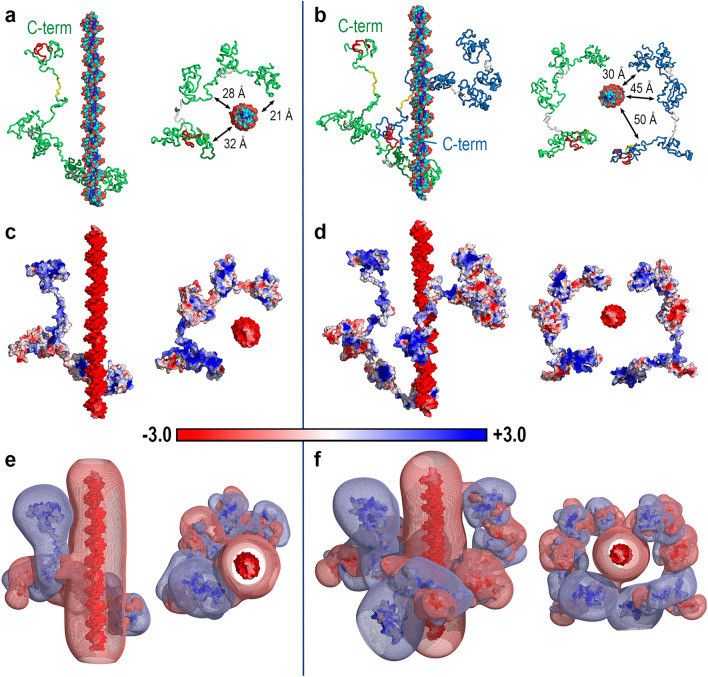
Figure 2.
Structure and Poisson-Boltzmann electrostatic potential of the initial geometries of Dsup-DNA complexes. (a) Side (left) and top (right) views of the initial geometry of the Dsup-DNA complex. The protein is shown as a green ribbon with regions corresponding to conserved sequence segments coloured as in Fig. 1a for Rv Dsup. DNA is shown as ball-and-sticks with P atoms in orange, O atoms in red, N atoms in blue and C atoms in cyan. Minimum distances between DNA and the three segments of Dsup closer to DNA are indicated in the top view. (b) Same views for the (Dsup)2-DNA complex. The first Dsup molecule hereby named DsupA is shown as in (a) and the second molecule hereby named DsupB is shown as a blue ribbon with the same colouring of sequence segments used in Fig. 1a for Rv Dsup. Minimum distances between DNA and the three segments of the second Dsup molecule closer to DNA are indicated in the top view. (c) Side and top views of the PB-EP mapped onto the surface of protein and DNA in the Dsup-DNA complex. (d) Same views as those shown in (c) for the (Dsup)2-DNA complex. The bar gives the colour code for the range of PB-EP values (in kT/e units) in these mappings. (e) PB-EP + 0.1 (light blue mesh) and -0.1 (light red mesh) isosurfaces superimposed on the surfaces shown in (c) for the Dsup-DNA complex. (f) Same views for the (Dsup)2-DNA complex.

