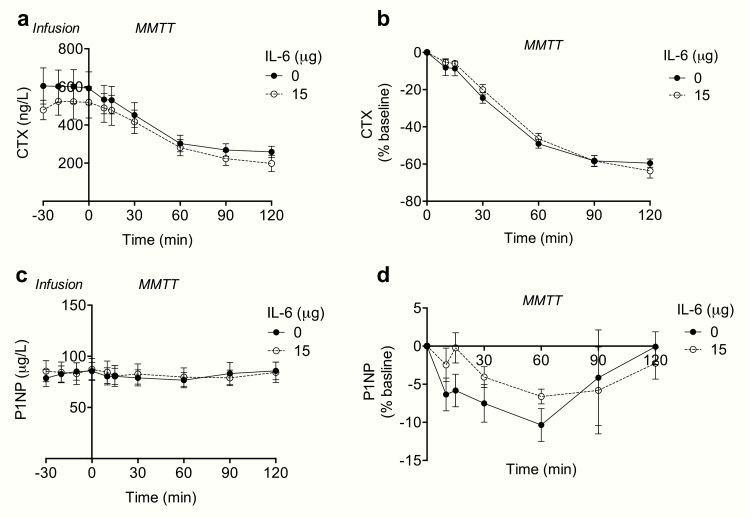
Figure 4.
CTX and P1NP in response to exogenous IL-6 and a liquid meal. Measurements of (A) plasma CTX and (C) plasma P1NP in response to infusion of saline (0 μg) and rhIL-6 (15 μg) (time point 0-30 min) and in response to a liquid meal (MMTT) (time point 0-120 min). (B) Plasma CTX and (D) plasma P1NP concentrations expressed as percentage change from baseline (time point 0). Data represent mean values; error bars indicate SEM. N = 10.

