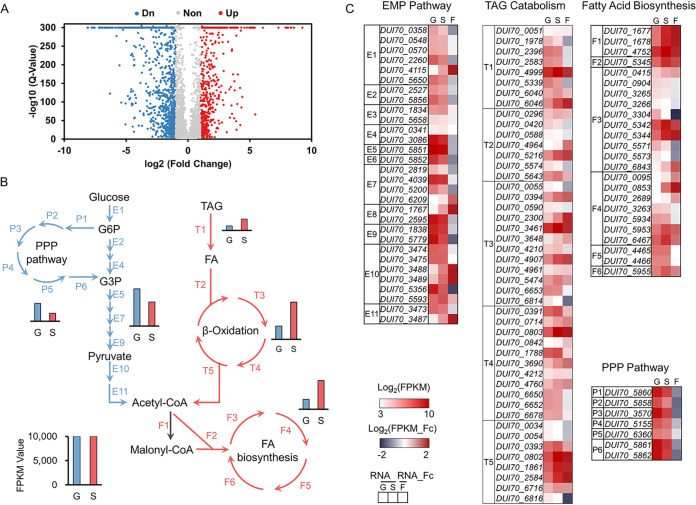
FIG 3.
Comparative transcriptomic profiling of S. albus ZD11 based on cultivation with different carbon sources. (A) Volcano map of differentially expressed genes. Blue points represent downregulated genes, red points represent upregulated genes, and gray points represent nonregulated genes. (B) Overall expression levels of the metabolic pathways for TAGs or glucose. Red and blue arrows represent the reaction steps involved in the metabolic pathways for TAGs and glucose, respectively. T, F, E, and P represent the reaction steps involved in the TAG hydrolysis and FA beta-oxidation pathways, the FA biosynthetic pathway, the EMP pathway, and the PPP, respectively. The sum of FPKM values of genes in one pathway represents the total expression level of this pathway. (C) The expression levels and fold changes of genes involved in above metabolic pathways. The RNA value is the normalized log2 FPKM value, and RNA fold change (RNA_Fc) is the normalized log2 ratio of FPKM values (FPKMoil/FPKMglucose). G and S indicate samples from glucose and oil medium, respectively. F represents the fold change in gene expression level in the oil medium relative to that in the glucose medium.

