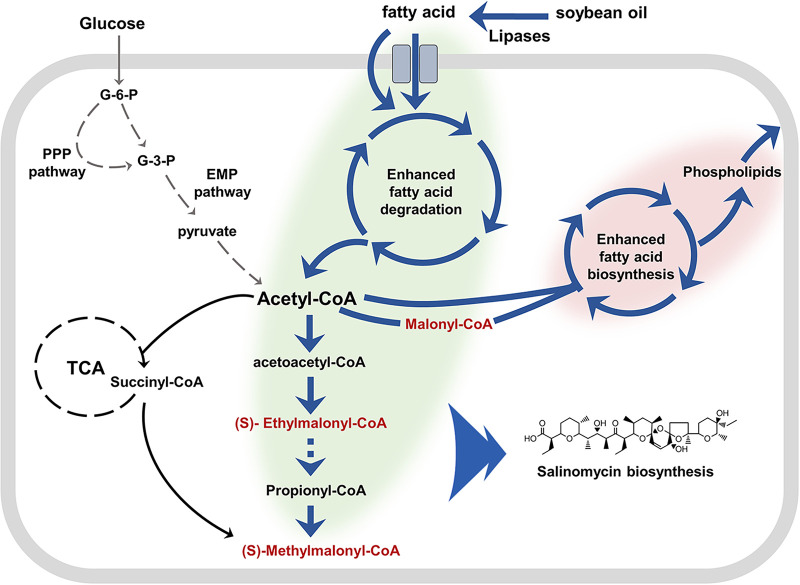
FIG 7.
Proposed schematic diagram of enhanced TAG metabolism in S. albus ZD11. Green shading represents the enhanced TAG catabolism and precursor biosynthesis. Pink shading represents the enhanced FA biosynthesis. Dark blue arrows represent the enhanced reaction steps, with gray arrows indicating weakened reaction steps and dashed arrows indicating multiple reaction steps. Intermediates (in red) are the direct precursors of salinomycin biosynthesis.

