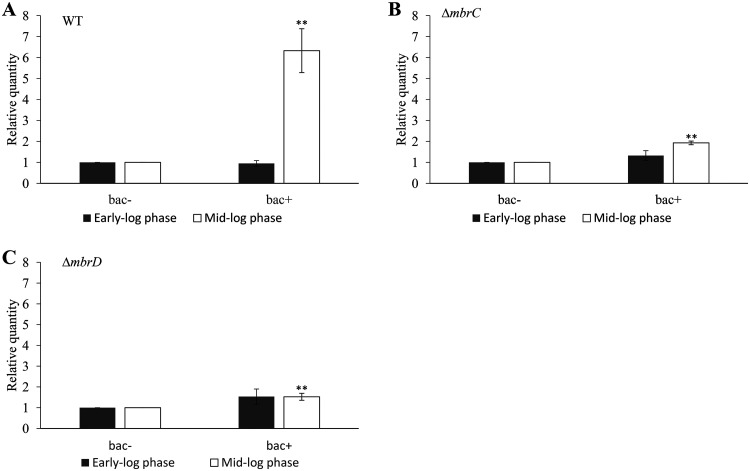
FIG 4.
Gene expression of atlA in the presence of sub-MIC of bacitracin. We determined the gene expression of atlA at an OD600 of 0.3 (early log phase) and an OD600 of 0.5 (mid-log phase). (A) The WT strain was cultivated in TSBg with 0.5 U/ml of bacitracin (1/8× MIC for the WT) (bac+) and without bacitracin (bac−). (B and C) The ΔmbrC (B) and ΔmbrD (C) mutant strains were cultivated in TSBg with 0.0625 U/ml of bacitracin (bac+) and without bacitracin (bac−). These figures indicate the relative expression levels of atlA compared with the expression in TSBg cultivated without bacitracin. These data were normalized to the expression of an endogenous control (lactate dehydrogenase, ldh). These data are the mean ± SD of three independent experiments. The asterisks indicate a significant difference between two groups (Student's t test; **, P < 0.01, versus bac−).

