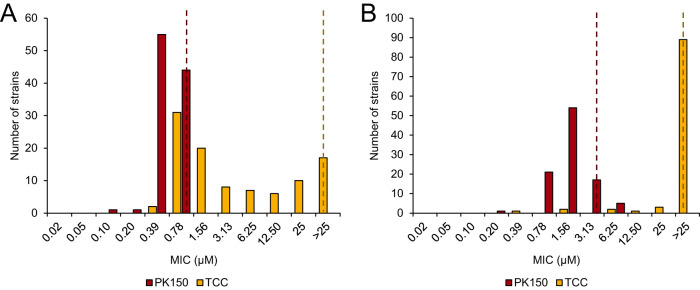
FIG 2.
TCC exhibits a different activity spectrum than that of PK150. MIC determination of PK150 and TCC against a panel of 100 strains of staphylococci (A) and enterococci (B) is shown. MICs were tested up to a concentration of 25 μM, and the distribution was plotted for each compound. Dotted lines indicate the respective MIC90 values. Experiments were performed in two biologically independent replicates, and for cases in which the MIC differed between the replicates the higher value was taken as the resulting MIC. See Data File S1 in the supplemental material for further details.

