FIG 4.
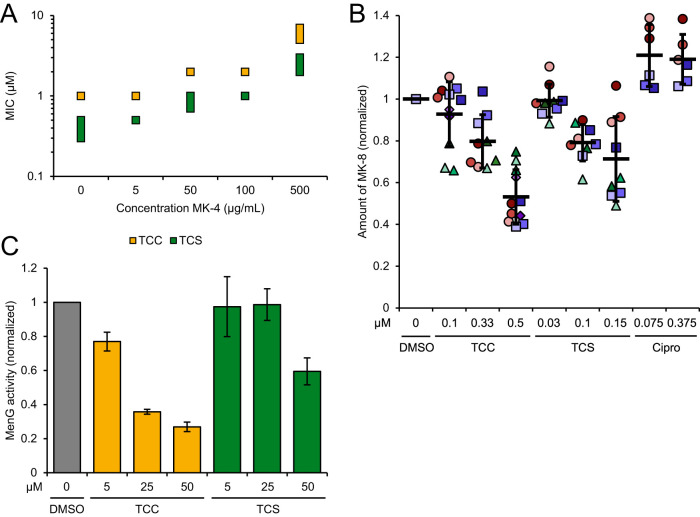
Interference with menaquinone biosynthesis and inhibition of MenG by TCC and TCS. (A) MIC shift by addition of menaquinone-4 (MK-4) to the bacterial growth medium. MICs of TCC and TCS were determined in the presence of various concentrations of MK-4 as indicated. The data represent results from three biologically independent experiments performed in triplicates. Where the MIC varied between replicates, the MIC is given as a range as displayed by the extension of the data point. (B) Metabolic profiling of endogenous menaquinone levels in S. aureus NCTC 8325 cells on compound treatment. Bacteria were treated with subinhibitory concentrations (0.1-fold to 0.5-fold of the respective MIC) of TCC, TCS, or ciprofloxacin (Cipro) and menaquinone-8 (MK-8) was extracted and quantified by LC–MS. MK-8 levels are normalized to DMSO-treated samples. Each color represents an individual, independent extraction experiment, where differently shaped symbols (circles, rectangles, triangles and diamonds) indicate independent biological samples. Error bars denote mean values ± SD. (C) Enzymatic assay monitoring the methylation of DMK-2 by cellular lysate of MenG-overexpressing S. aureus pRMC2-MenG (20 mg/ml total protein concentration). Production of MK-2 was quantified by liquid chromatography-mass spectrometry (LC-MS) and normalized to the respective DMSO-treated samples. Data represent the averaged values ± SD from three independent experiments.

