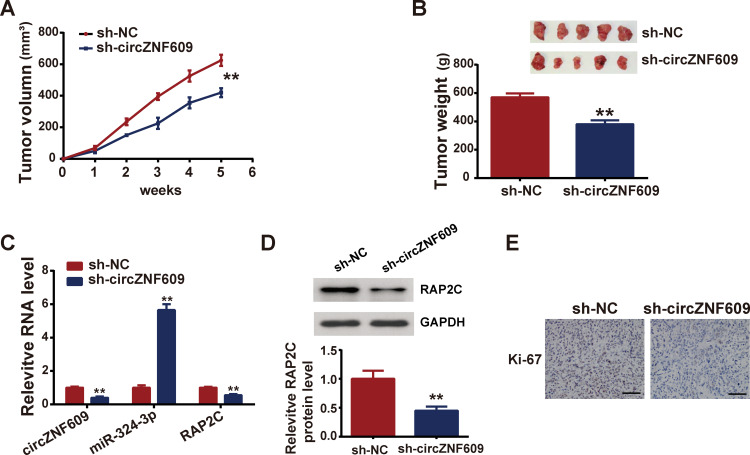
Figure 6.
Depletion of circZNF609 restrained tumorigenesis in vivo.
Notes: HepG2 cells expressing sh-circZNF609 were injected into mice, forming sh-circZNF609 mice group, and HepG2 cells expressing sh-NC were also injected into mice, forming negative control group. (A) Tumors were measured weekly to record the size; (B) tumors were removed weighed 35 days later; (C) expressions of circZNF609, miR-342-3p and RAP2C were determined by qPCR; (D) PAP2C protein level was measured by Western blot; (E) ICH staining was utilized to assess the Ki67 expression. Scale bar represents 200μm. **P<0.05.

