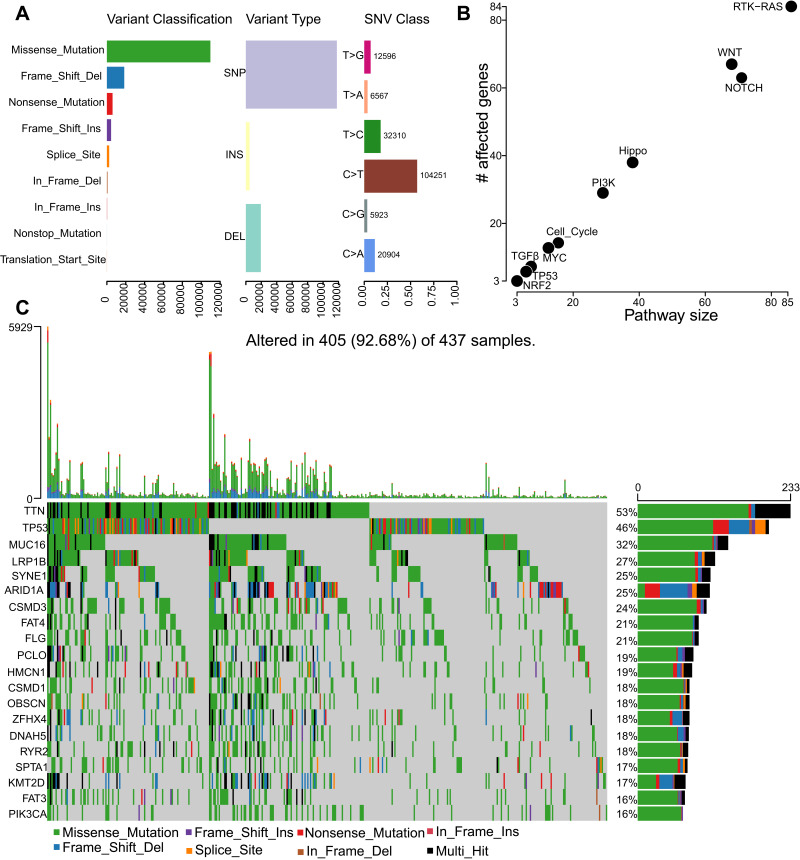
Figure 1.
The somatic mutation landscape in STAD. (A) Bar plot of the distribution of mutation spectra in STAD. The distribution of Variant classifications, Variant types, and SNVs and their Variant numbers in STAD. (B) Dot plot of the pathway enrichment analysis of the mutated genes. (C) Oncoplot displaying the somatic mutation landscape of STAD cohort. Genes are ordered by their mutation frequency.

