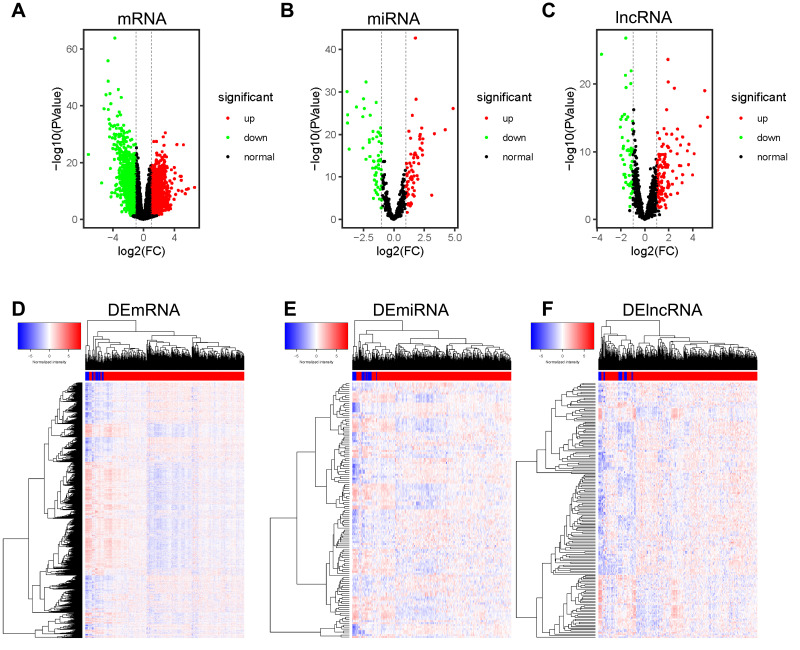
Figure 2.
Expression profiles of mRNA, miRNA, and lncRNA in STAD. (A–C) Volcano plot of expression profiles of mRNA, miRNA, and lncRNA. The red dot represents up-regulated RNAs, the green dot represents down-regulated RNAs, and the black dot represents normal RNAs. (D–F) Heatmap of differentially expressed RNAs (DERNAs). The DERNAs are selected with thresholds of P-value≤0.01 and |log2Fold change|≥1.

