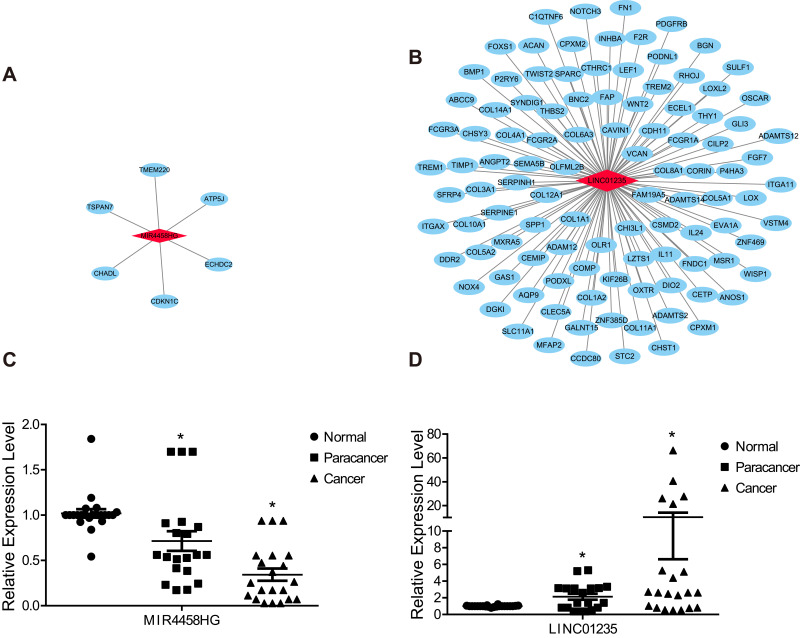
Figure 6.
The potential function of the two candidate lncRNAs. (A, B) The network of the two candidate lncRNAs with misregulated mRNAs; LncRNA, light red diamond; mRNA, light blue ellipse. (C, D) Bar plot of the relative expression levels of the two candidate lncRNAs in collected STAD samples, and P-value≤0.05 is regarded as significant.

