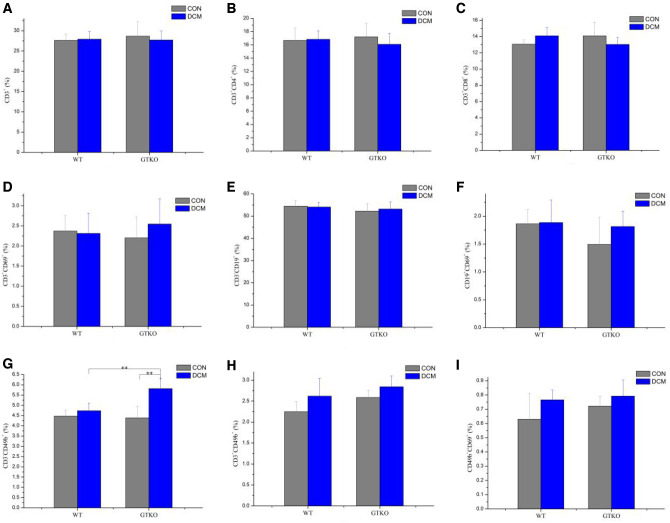
Figure 3.
The ratios of CD3+ T-lymphocytes (A), CD3+CD4+ T-lymphocytes (B), CD3+CD8+ T-lymphocytes (C), CD3+CD69+ activated T-lymphocytes (D), CD3-CD19+ B-lymphocytes (E), CD19+CD69+ activated B-lymphocytes (F), CD3-CD49b+ NK cells (G), CD3+CD49b+ NKT (H) and CD49b+CD69+ activated NKT (I) in the control (CON) group and decelluarized corneal matrix (DCM) group of the WT and GTKO mice after 4 weeks of implantation, of which spleen single cell suspensions were analyzed by flow cytometry. The values were represented as mean ± SD. *P <0.05, **P < 0.01.

