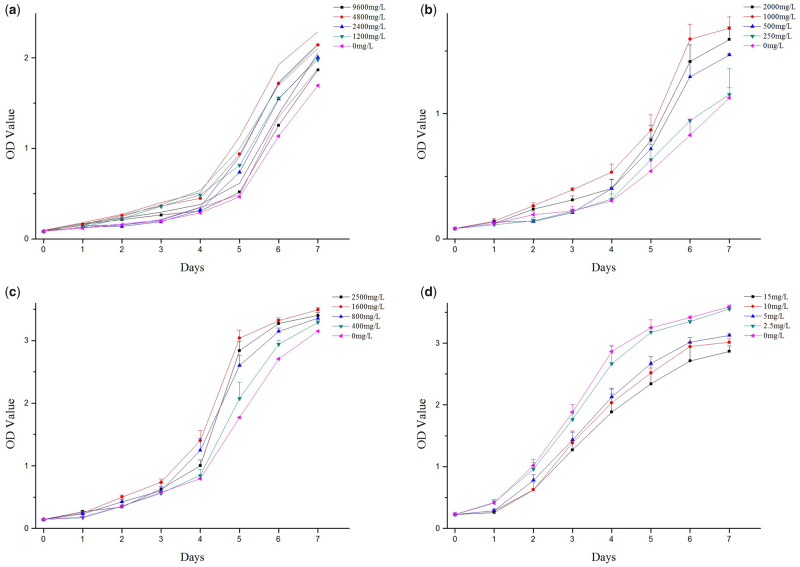
Figure 3.
Cell growth curves of HUVECs under different culture conditions. (a) Collagen solution; the optimal concentration was 4800 mg/l. (b) Chitosan solution; the optimal concentration was 1000 mg/l. (c) Collagen-chitosan mixed solution; the optimal concentration was 1600 mg/l. (d) AgNP solution; the concentration of limited inhibitory effect was 2.5 mg/l

