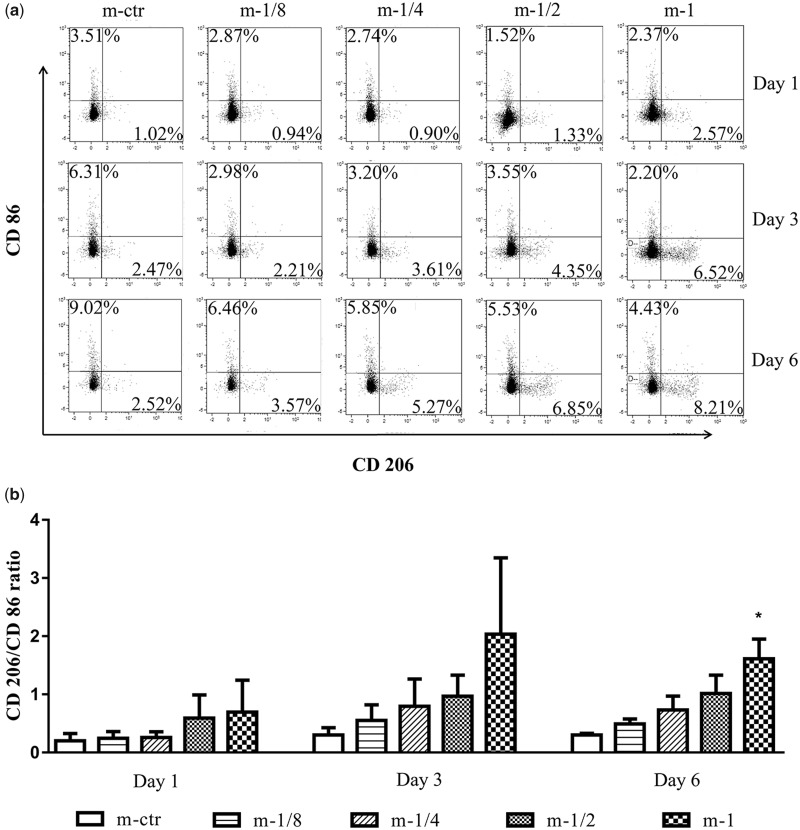
Figure 6.
Quantitative analysis of THP-1-derived macrophage polarization. (a) A representative result of cell surface markers CD86 and CD206 expressions on THP-1-derived macrophages determined by flow cytometry. (b) The statistical analysis of CD206/CD86 ratio calculated from the flow cytometric plots of five groups at varied time points. *P < 0.05 vs. m-ctr group.

