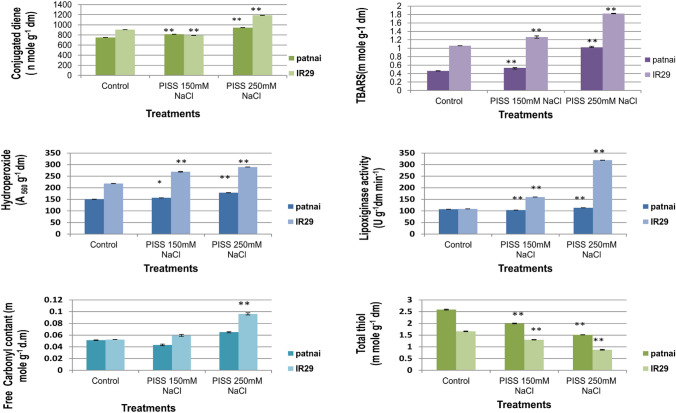
Fig. 5.
Assessment of redox biomarkers [assessed in terms of status of membrane lipid peroxidation (accumulation of hydroperoxide, conjugated diene, thiobarbituric acid reactive substances and lipoxygenase activity), protein oxidation (free carbonyl content) and total thiol content] of PISS-raised 120 h old seedlings of two contrasting rice genotypes differing in sensitivity towards salinity stress (Oryza sativa L. Cultivars of Patnai & IR29). Values are mean of three independent replicates ± standard error. * or ** represent the values which are significantly different level, at 0.01, 0.05, level, assessed through student t test

