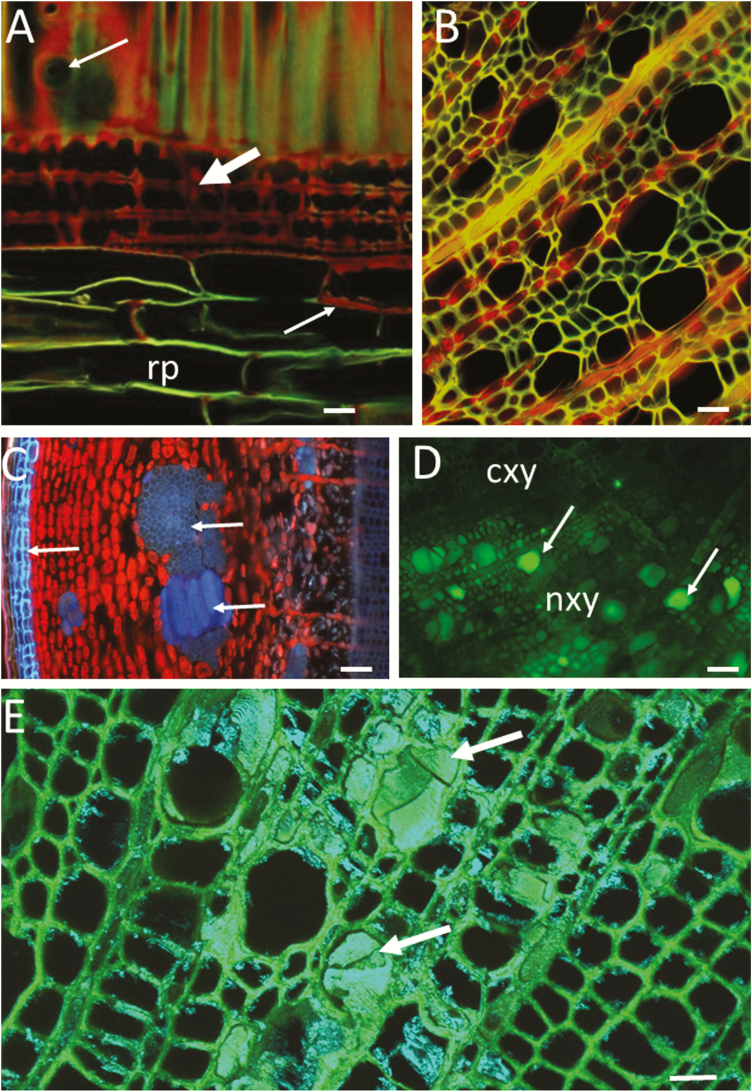
Figure 1.
Visualization of lignin, suberin and extractives on microtome-planed surfaces of wood (A, D, E), and on hand-cut sections (B, C). Safranin staining (A) and autofluorescence (B through D). (A) Radial-longitudinal section, ~60-µm-thick, through the sapwood of a ponderosa pine tree (Pinus ponderosa) visualized by CLSM after safranin staining. The red colour corresponds to more lignin. The upper arrow points to a bordered pit in the radial wall of an earlywood tracheid. The lignified walls of axial tracheids show a mixture of red and green fluorescence depending on the lignin proportion of the sectioned wall layer, middle lamella (red) or S2 (green). The middle arrow points to ray tracheids, and the lower arrow points to a lignified ray parenchyma cell (indicated with red colour and thick wall). The ray tracheids are strongly lignified (red colour) while most of the ray parenchyma cells in this species have non-lignified walls (a single optical section, Plan-Neofluar 40×/water, merged two-channel excitation\emission: 488\500–530 and 543\LP 590; Zeiss LSM510). (B) Hand-cut, transverse section of a young poplar stem (Populus sp.) visualized by wide-field fluorescence (excitation/emission, 450–480/LP 515; Nikon; Eclipse E400). Green is emitted from lignified walls and red from chloroplasts in ray parenchyma. The orange-yellow colour is a mixture of red and green indicating that the horizontal wall of ray cells is near the surface of the section. (C) Transverse cut through the cortex of a 1-year-old poplar stem (Populus sp.) after some development of secondary bark has occurred (wide-field with no staining, excitation/emission, 330–385/LP 420; Nikon; Eclipse E400). The uneven focus is due to the rough surface of the sectioned cortex that contains cell types with contrasting density and hardness (see the text for discussion on hand sections). The arrow at the left points to blue fluorescence from cork. The two arrows at the right point to blue fluorescence from lignified sclerenchymatic cells. The red fluorescence is emitted from chloroplasts in cortical parenchyma and rays. A small portion of last-formed xylem (weak, blue fluorescence) can be seen at the right side of the micrograph. (D) Transverse-cut surface of wood of a low-lignin hybrid poplar tree (Kitin et al. 2010). The sample was cryo-fixed and cut in the frozen state, then visualized in the frozen state by wide-field fluorescence without staining (blue excitation and band-pass emission BP 510–530; Nikon; Eclipse E400). Xylem areas that are not functional for water conduction (nxy) contain xylem vessels filled with phenolics (arrows) while no occlusions are visible in the conductive xylem (cxy). The lignification of the conductive xylem is normal; however, the lignin autofluorescence is considerably weaker (not visible with the selected laser power/detector gain) compared with the fluorescence of lumen phenolics. (E) A similar wood sample as in (D) but freeze-dried and visualized at room temperature by CLSM (LSM 510; Carl Zeiss). Arrows point to xylem vessels occluded with phenolics. After freeze-drying, the phenolics emit strong blue and green fluorescence. A single-track, two-channel image with 405- and 488-nm laser lines and band-pass filters BP 420–480, BP 505–530. The image is a maximum projection of four optical sections at 1-mm intervals. Bars = 20 µm (A and E), 50 µm (B, C and D). cxy, conductive xylem; nxy, non-conductive xylem; rp, ray parenchyma.

