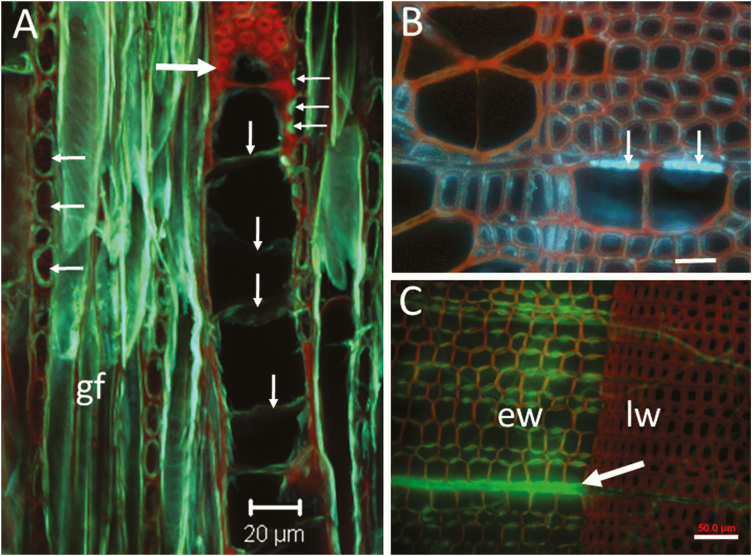
Figure 2.
Visualization of lignified and non-lignified cellulosic cell walls in thick sections stained with calcofluor (A) or with safranin-calcolfluor (B, C). The sections are 40- to 60-µm-thick, cut with a sliding microtome. (A) Cellulosic walls (blue-green fluorescence) of gelatinous fibres (gf), ray cells and tyloses in wood of a low lignin poplar mutant. Red autofluorescence is emitted from the lignified vessel wall showing bordered pits. This is a 60-µm-thick tangential-longitudinal section of a sample similar to those in (Fig. 1D and E), but after the extraction of phenolics and stained with calcofluor. Tyloses (vertical arrows); ray cells (horizontal arrows on the left); xylem vessel wall with bordered pits (large arrow); and membranes of parenchyma-to-vessel pits (horizontal arrows on the right) are shown. Image by CLSM (Zeiss, LSM 510; maximum projection of 31 optical sections at 0.95-µm intervals and band-pass filters (Blue: 405 ex/BP 420–480, Green: 488 ex/BP 505–530, Red: 543 ex/BP 590–650)). (B) Transverse section of poplar wood (Populus tremuloides) visualized by wide-field fluorescence (Olympus BX60; 330–385 excitation, 420 LP emission). Red fluorescence from lignified walls is visualized simultaneously with blue fluorescence from cellulosic portions of the walls. The arrows point to non-lignified pit membranes of half-bordered pits between ray parenchyma and xylem vessels. Weaker blue signal is emitted from non-pit portions of the lignified walls of fibres where cellulose was exposed to calcofluor staining. The cellulose in lignified walls can become accessible to staining in damaged wall areas such as small cracks that are caused during sectioning. (C) Transverse section of spruce wood (Picea glauca) visualized by wide-field fluorescence (Olympus BX60). The section was inoculated with the white rot fungus Phanerochaete chrysosporium which removes lignin from cell walls. The arrow points to fluorescence from calcofluor-stained cellulose in a delignified xylem ray 20 days after inoculation. This image was acquired by merging the fluorescence signal from calcofluor-stained cellulose (330–385 excitation, 420 LP emission) with the red fluorescence signal from safranin-stained lignified walls (green excitation, LP 560 emission). Green colour was artificially assigned to the calcofluor signal for a higher contrast (for more details, see the text for discussion on multichannel imaging). The combination of green and red provides a clearer view of the cellulose exposure that occurs predominantly in the rays and in the radial walls (pit regions) of earlywood tracheids. Bars = 20 µm (A) and 50 µm (B and C). ew, earlywood; gf, gelatin fibres; lw, latewood.

