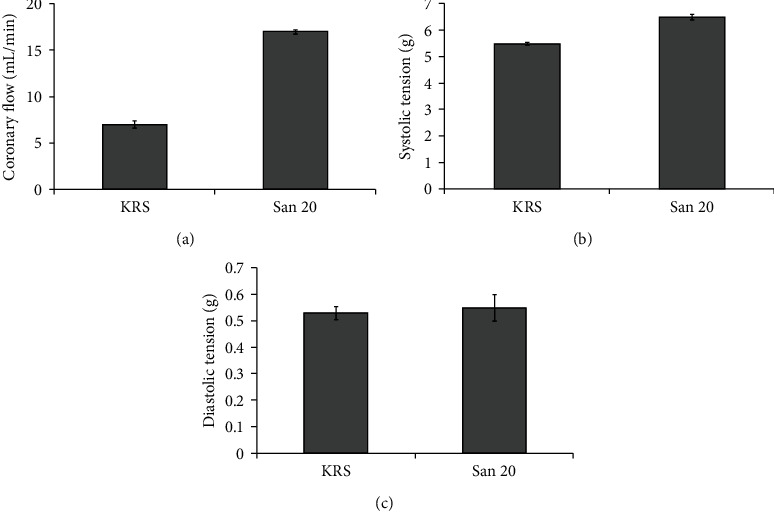
Figure 5.

Comparison of average coronary flow (a), systolic tension (b), and diastolic tension (c) in two different treated groups of rat hearts after cold ischemia. In each group, ten different hearts were used (n = 10). The error bars represent the standard deviation in each group. Compared to each other, there was no statistically significant difference in diastolic tension but a distinct significant higher coronary flow and systolic tension in the San 20 group.
