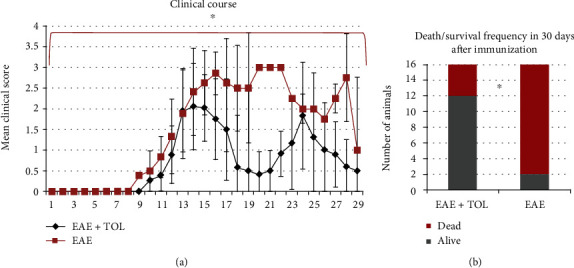
Figure 1.

Clinical course and death frequency in the EAE and EAE+TOL groups. (a) The clinical course in the EAE (n = 16) and EAE+TOL (n = 16) rat groups. Values are presented as mean ± SD (Mann–Whitney U test) using EAE scores of each animal for every day. (b) Death/survival frequency during 30 days after EAE induction. Values are presented as a number of animals per group (Fisher's exact test); ∗p < 0.05.
