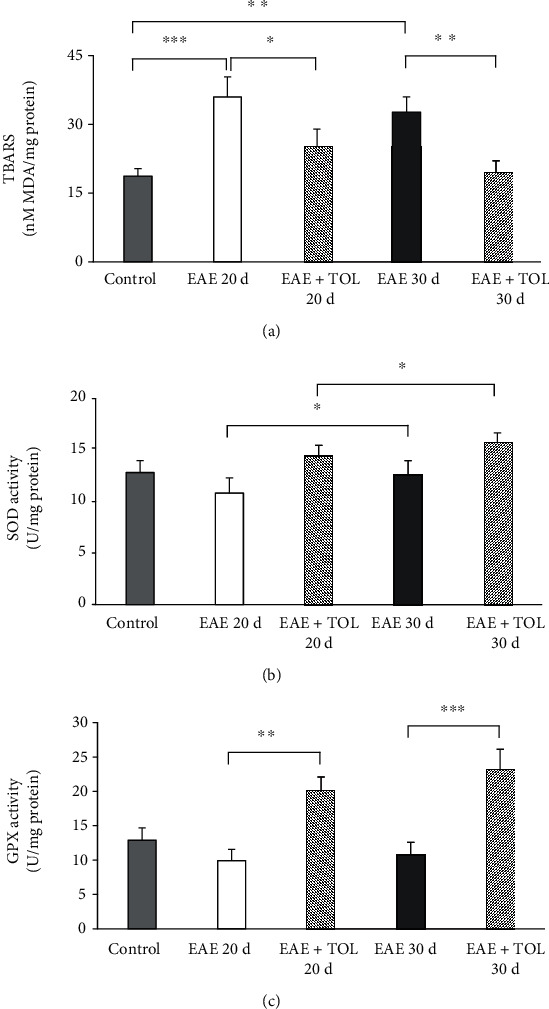
Figure 2.

Biochemical assays in the rat brain. (a) The concentration of MDA (nM/mg protein), (b) the activity of SOD (U/mg protein), and (c) the activity of GPX (U/mg protein) in the healthy untreated group (control), in the groups induced EAE after 20 days (EAE 20d) and 30 days (EAE 30d) postimmunization and EAE groups with olive leaf therapy (EAE+TOL 20d and EAE+TOL 30d). For each group, values are presented as the mean ± SD of five rats per group. One-way ANOVA followed by the post hoc Scheffé test was used for the statistical analysis: ∗p < 0.05, ∗∗p < 0.01, and ∗∗∗p < 0.001.
