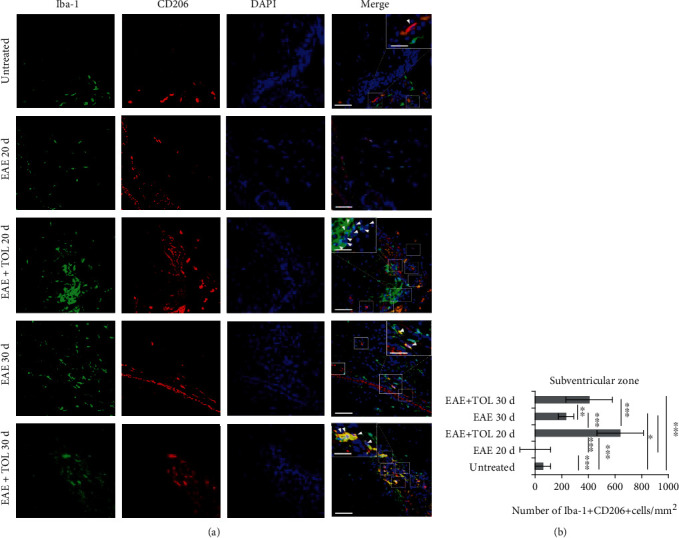
Figure 9.

(a) Representative immunofluorescent pictures show the relationship between CD206+ and Iba-1+ (M2) microglia cells in the subventricular zone: untreated, with induced EAE and the second attack (on the 20th day postinduction), with induced EAE and treated with TOL till the 20th day postinduction, with induced EAE and the second remission (on the 30th day postinduction), and with induced EAE and treated with TOL on the 30th day postinduction. (b) The number of Iba-1+ CD206+ cells was manually counted in the area of interest (0.053 mm2/4 μm slice × 3 slices/rat × 5 rats/group). Values are expressed as mean gray value ± SD of a number of cells per mm2. One-way ANOVA followed by the post hoc Scheffé test: ∗p < 0.05, ∗∗p < 0.01, and ∗∗∗p < 0.001. Scale bars indicate 50 μm and 20 μm (insets).
