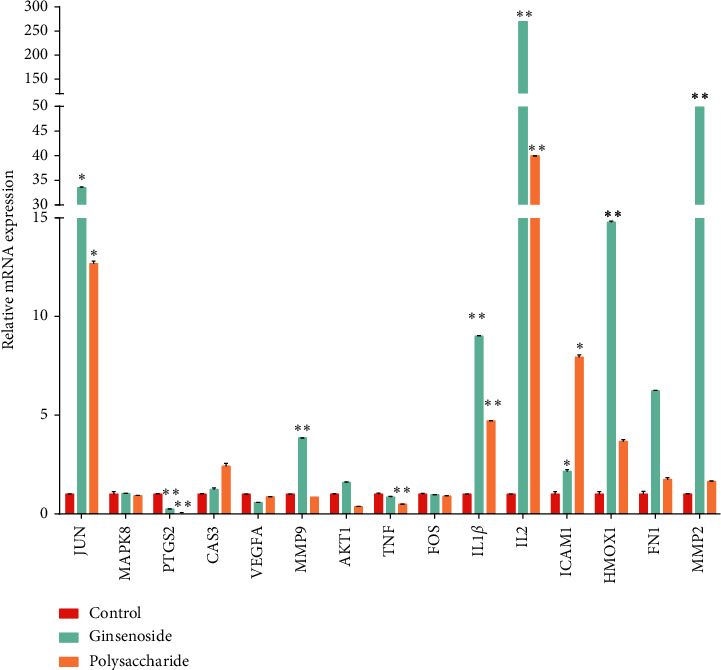
Figure 6.

The mRNA expression levels of 15 core targets. Compared with the control group, the expression levels of JUN, IL-1β, IL-2, ICAM1, HMOX1, MMP9, MMP2, PTGS2, and TNF mRNA in the administration group have significant difference in the treatment group (∗p < 0.05, ∗∗p < 0.01).
