
Fig. 6. Changes in wind-stress curl and gyre circulation.
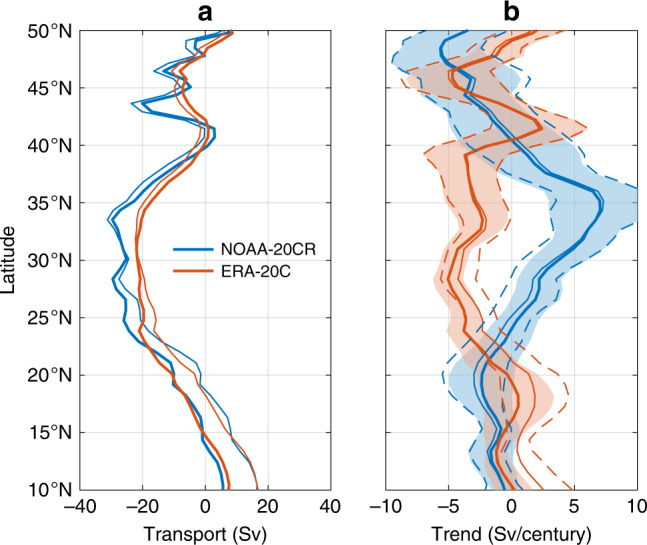
a Thick lines are time-mean geostrophic Sverdrup streamfunction9 based on wind-stress curl from NOAA 20CR61 and ERA 20C62 reanalyses over 1900–2010 as a function of latitude in the North Atlantic. Thin lines are the same, but also incorporate the ageostrophic Ekman transport integrated across the basin. b Median estimates (thick lines) and formal 95% confidence intervals (colored shading) of the trend in Sverdrup streamfunction versus latitude during 1900–2010 from the two reanalyses. Thin and dashed lines represent median estimates and confidence intervals, respectively, with Ekman transports also included.