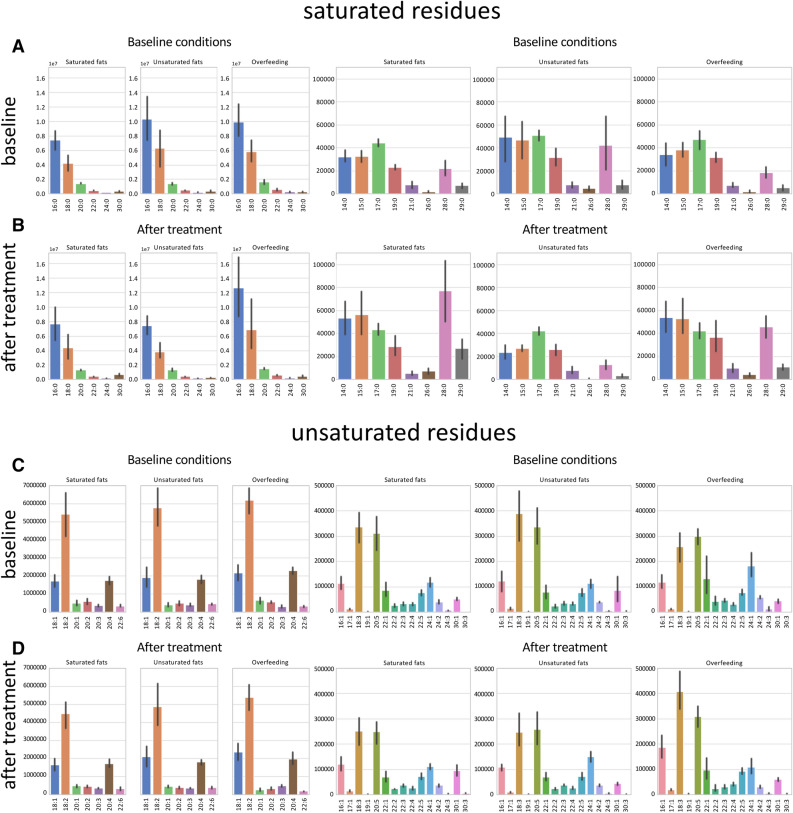
Figure 4.
Distribution of fatty acid moieties among individuals at baseline and after different dietary protocols. Residues extracted from lipidomic data of human plasma (n = 7 subjects per group) are shown. Residues were divided into saturated residues (top, A,B) and unsaturated residues (bottom, C,D). There are three experimental conditions total: isocaloric diet with ~ 42.5% saturated fats (Saturated fats), ~ 42.5% monounsaturated fats (Unsaturated Fats) or 2000 kcal above baseline (Overfeeding). Each experimental condition has its own baseline. Histograms show the average ± SD.

