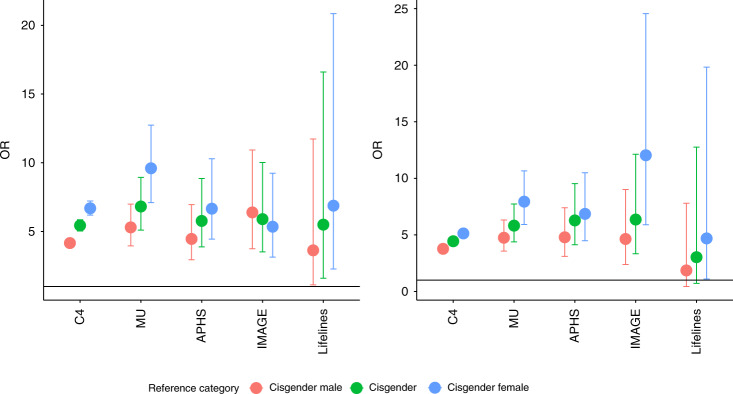
Fig. 2. ORs and 95% CIs for autism in transgender and gender-diverse individuals compared to cisgender males, cisgender females, and cisgender individuals altogether.
a This figure provides the unadjusted Odds Ratios (ORs, point) and 95% CIs for autism in transgender and gender-diverse individuals compared to either cisgender males, cisgender females, or cisgender (cisgender males and cisgender females) individuals in five datasets (C4: N = 514,100; MU: N = 85,670; APHS: N = 2312; IMAGE: N = 1803; and LifeLines: N = 37,975). b This figure provides adjusted ORs (point) and 95% CIs for autism in transgender and gender-diverse individuals compared to cisgender males, cisgender females, or all cisgender individuals in five datasets (C4: N = 514,100; MU: N = 85,670; APHS: N = 2312; IMAGE: N = 1803; and LifeLines: N = 37,975). ORs have been adjusted for age, educational attainment, and in the case of IMAGE dataset, an additional dummy variable for study (see “Supplementary Methods”). The y-axis is on the same scale for both the panels. The differences in ORs for the IMAGE dataset between Models 1 and 2 is primarily due to the inclusion of “study” group as a covariate. Specifically, the IMAGE dataset consists of individuals recruited into a study of mathematics and autism (“Methods”). Whilst the mathematics group is predominantly male and have higher educational attainment (all have at least an undergraduate degree), the case–control group had a more balanced ratio and a wider range of educational attainment. Covarying for the study the participants have been recruited into (mathematics or autism case–control) changes the ORs.

