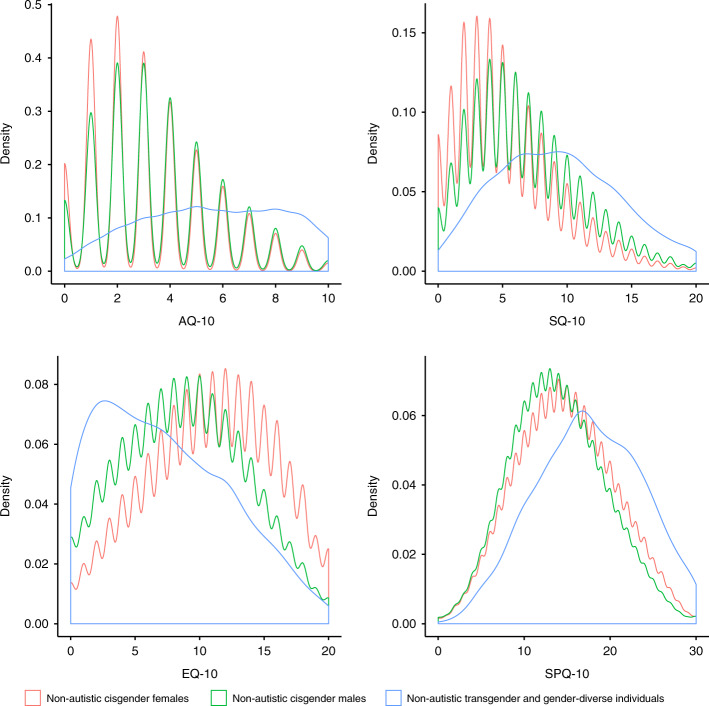
Fig. 3. Kernel density plot of scores on the four self-report measures in the C4 Dataset for non-autistic individuals only.
This figure provides kernel density plots for scores on the four self-report measures (AQ-10, EQ-10, SQ-10, and SPQ-10) for non-autistic participants from the C4 dataset (N = 514,100) based on their gender (cisgender males, cisgender females, transgender and gender-diverse individuals). Scales on the axes are different between the panels. See Supplementary Fig. S1 which provides kernel density plots for all four measures for both autistic and non-autistic individuals. The non-autistic transgender and gender-diverse kernel density plots appear smoother due to the relatively low number of participants included, hence providing less resolution in the kernel density estimates when compared to the non-autistic cisgender males and non-autistic kernel density plots.

