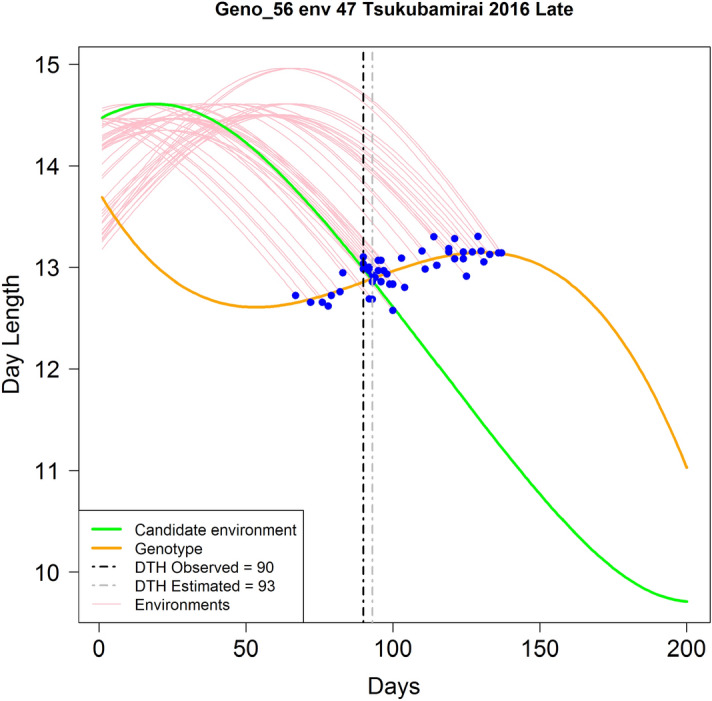
Figure 3.

Graphical representation of the C method for estimating days to heading (DTH, x-axis) of genotype 56 in environment 47 (env 47 Tsukubamirai 2016 Late). Pink curves represent the daily day length (hours) values (DL, y-axis) from planting day (day 1) until heading time for genotype 56 in 50 environments (1–46, and 48–51). The blue dots indicate the corresponding DL values when genotype 56 reached heading time. The green curve (C2) represents daily DL progression of the target environment (Environment 47) where no genotypes have been observed yet. The orange curve (C1) represents the fitted line for genotype 56 using a third-degree polynomial equation relating DL at the occurrence time (DTH across environments). The vertical dotted gray line shows the intersection (93 days) between the green and the orange curves (C1, C2). This value is the estimated DTH for genotype 56 in the unobserved environment “env 47 Tsukubamirai 2016 Late”. The vertical dotted black line corresponds to the actual DTH (90 days) value for env 47.
