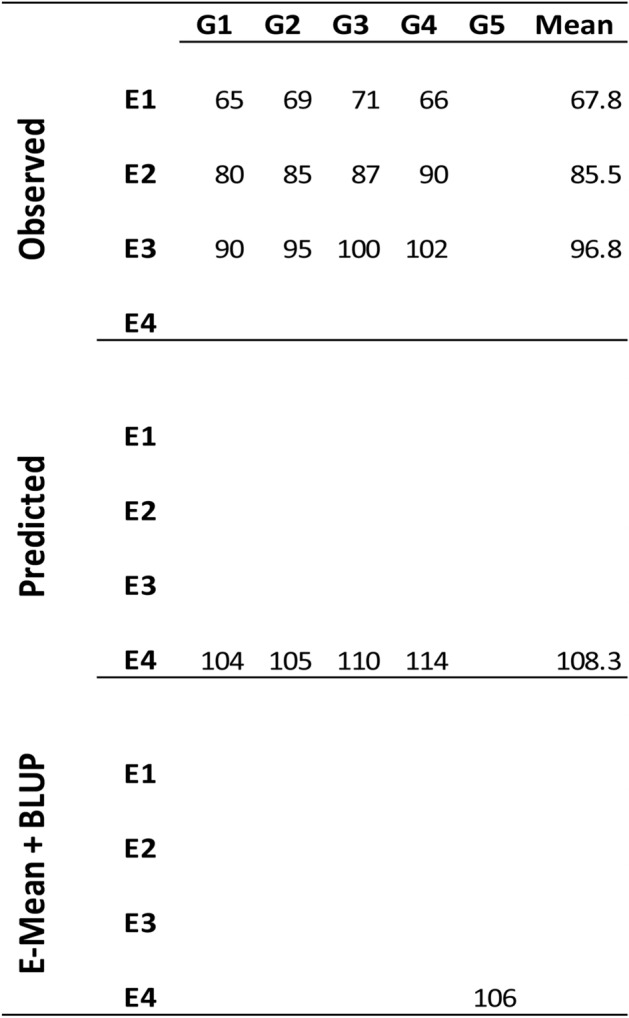
Figure 4.

Representation of the procedure for predicting DTH for the untested genotype G5 in the unobserved environment E4 using the information of four genotypes (G1, G2, G3, and G4) observed in three environments (E1, E2, and E3). The top panel contains the observed values for genotypes (G1, G2, G3, and G4) in environments (E1, E2, and E3). The middle panel contains the predicted values that presumably were obtained with the C method for these genotypes in the unobserved environment E4. Also, the E-mean (108.3) of E4 is computed as the mean of the predicted values for genotypes G1, G2, G3, and G4. The bottom panel contains the predicted DTH value (106) of genotype G5 in environment E4 as the sum of the E-mean (108.3) computed in the previous step and the genomic BLUP (-2.3) obtained with the conventional GS implementation.
