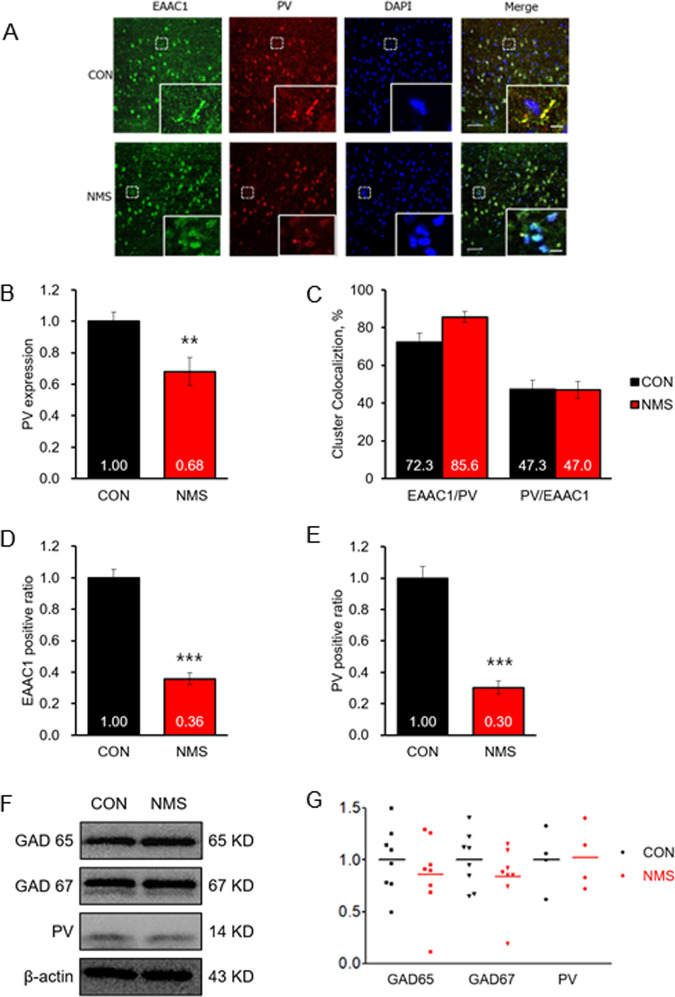
Fig. 6. Decreased EAAC1 and PV-positive neurons in the hippocampus of NMS rats.
a Coronal sections of the hippocampus were stained with anti-EAAC1 and anti-PV antibodies. Immunoreactivity was visualized using Alexa 488-conjugated secondary antibodies of anti-EAAC1 and Oyster 550 fluorescence-labeled primary antibodies of anti-PV. Scale bar, 50 µM; inset, enlarged areas. Scale bar, 5 µm. b Quantification analysis of PV immunoreactivity in (a). Fluorescence density of PV (red) and analysis by confocal microscopy. The data on PV staining quantification are expressed as the means ± S.E.M.; n = 10. **P < 0.01. c Quantification analysis of PV (red) clusters with EAAC1 (green) and EAAC1 clusters with PV in (a). The quantification data on EAAC1 and PV staining are expressed as the means ± S.E.M.; n = 16. d Quantification of the EAAC1 cluster number in (a). The results are presented as the means ± S.E.M.; n = 16. ***P < 0.001. e Quantification of the PV cluster number in (a). The results are presented as the means ± S.E.M.; n = 16. ***P < 0.001. f Immunoblot analysis of GAD65, GAD67, and PV in the hippocampus of CON and NMS rats. g Quantification analysis of GAD65, GAD67, and PV immunoreactivity in (f). The results are presented as the means ± S.E.M.; n = 8 (GAD 65, GAD67), n = 4 (PV).

