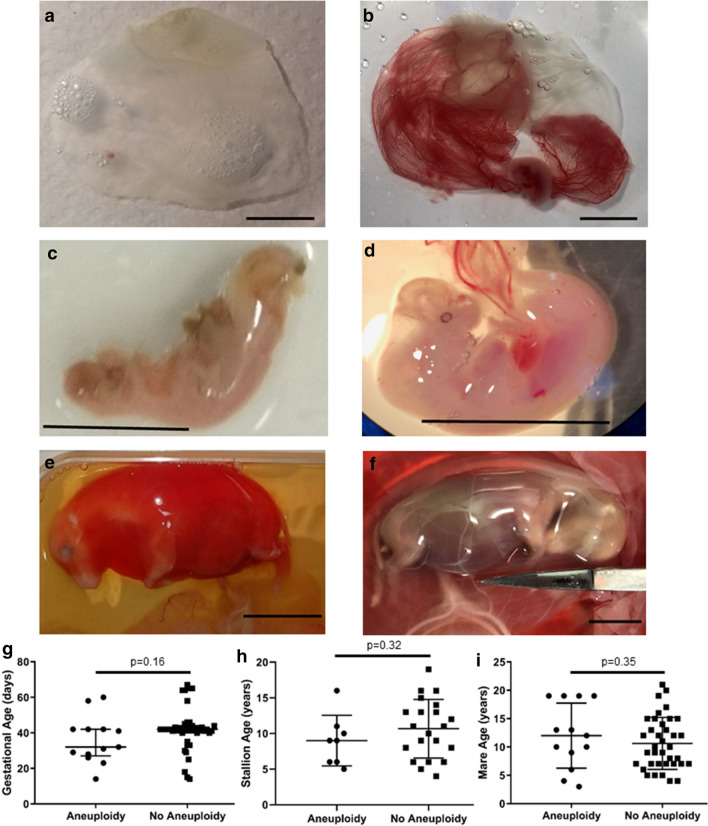
Figure 4.
Phenotypes and clinical analysis of aneuploidies. (a) Monosomy 31, 29 day gestation failed conceptus and (b) age matched 29 day clinically normal conceptus. (c) Trisomy 30, 32 day gestation failed embryo proper and (d) age matched 33 day clinically normal embryo proper. (e) Monosomy 27, 60 day gestation failed fetus and (f) age matched 64 day clinically normal fetus. Scale bar = 1 cm for all images. (g) Gestational age, (h) stallion age, and (i) mare age did not significantly differ between aneuploidy EPLs and non-aneuploidy EPLs. Mean with standard deviation plotted.

