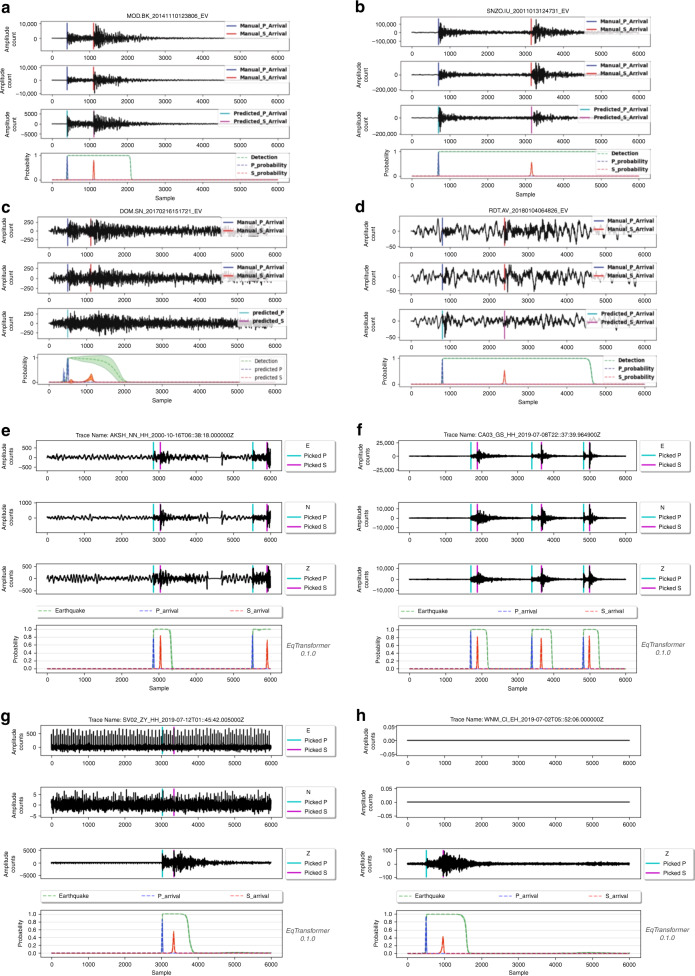
Fig. 4. Test results.
Four representative waveforms (a–d) from the test set and four waveforms from applying the model to continuous data in Tottori, Japan (e) and Redgcrest, California (f–h) presenting performance of the model on different types of data. Each waveform is 60 seconds long with 100 samples per second band-bass filtered from 1-45 Hz. Each panel shows three channel waveforms on top and output predictions of the model for earthquake signal detection, P-arrival, and S-arrival at the bottom. In a to d, the vertical color-coded lines on first two channels are manual arrival time picks from catalogs. a is an event with the local magnitude of 2.2 recorded in 55 km distance from the epicenter, b is an event with the local magnitude of 4.3 recorded 173 km away from the epicenter, c is an event with the local magnitude of 0.1 recorded 38 km away from the epicenter, and d is an event with the local magnitude of 2.0 recorded 110 km away from the epicenter. The output probabilities are presented as distributions that can represent variations or model uncertainties. e to h are detected events after applying the model to continuous data, representing the performance of the model when more than one event exists in a 1-minute window (e and f), when data contains gaps filled by zeros (e), when an event occurs near the edge (e), when two channels are broken or noisy (g), or when only one component data exists (h).

