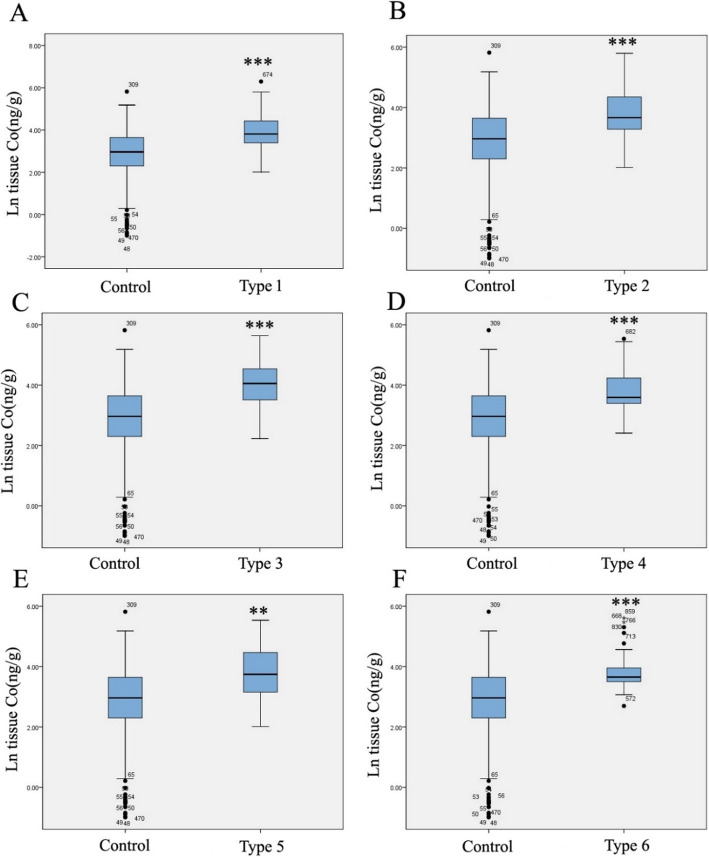
Fig. 3.
Levels of cobalt in CHD subtypes and control groups in fetus placental tissues. Boxplots of cobalt levels (Napierian logarithm transformed) of fetus placental tissue samples. The line inside the box = medians; the box length = interquartile range (IQR); the upper and lower ends = 95 and 5% value. One-sample Kolmogorov-Smirnov test was used to verify the distributions of cobalt. **P < 0.01 or ***P < 0.001, cases compared to the control group. Type1, septal defect; type 2, conotruncal defects; type 3, right ventricular outflow tract obstruction; type 4, left ventricular outflow tract obstruction; type 5, anomalous pulmonary venous return; type 6, other heart defects

