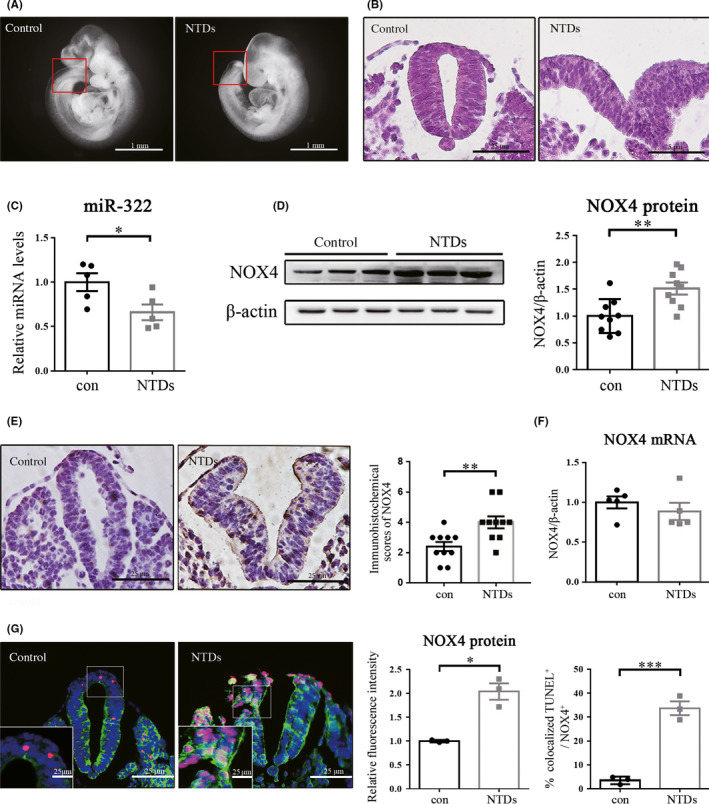
Figure 1.

Expression of miR‐322 and NOX4 in NTDs caused by ATRA. (A) Morphology of normal and NTDs embryos at E9.5. (B) HE staining images of the neural tube transverse sections of normal and NTD embryos at E9.5. (C) Relative expression of miR‐322 was measured by qRT‐PCR using U6 as an internal control. (D) Western blot was performed to examine NOX4 levels using β‐actin as an internal control. (E) Representative IHC images of NOX4 expression in neural tube at E9.5 and semi‐quantitative analysis of the IHC results. (F) The relative expression of NOX4 mRNA was tested by qRT‐PCR using β‐actin as an internal control. (G) Representative immunofluorescence results of NOX4 (green) and the TUNEL signal (red) in E9.5 samples. DAPI (blue) was counterstained to reveal the nucleus. Statistical analysis of the fluorescence intensity and the percentage of TUNEL positive signal colocalized with strong NOX4 expression. The result represents three repeated experiments. “*,” “**,” and “***” represented P < .05, P < .01, and P < .001, respectively
