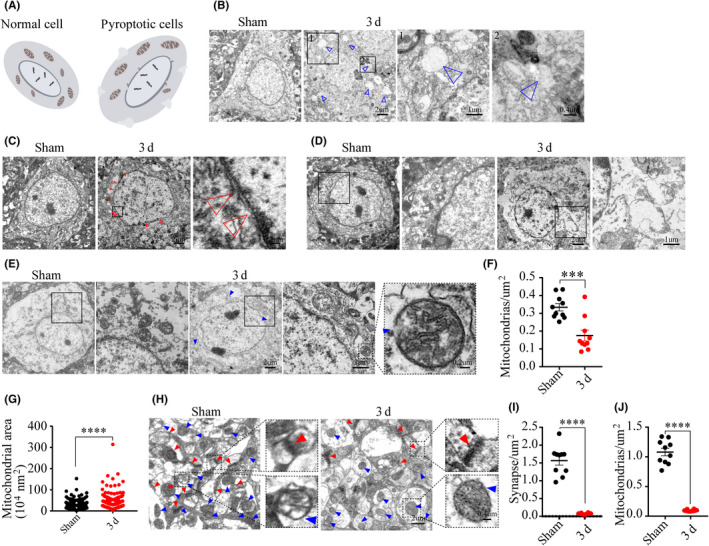
FIGURE 2.

The ultrastructural damages of cells in the peri‐ischemic region. (A) A schematic graph shows the ultrastructural damage of neurons. (B) Representative images showed the difference between the plasma membrane of the PT group and sham‐operated group, and the hollow blue arrowheads indicate holes. (C‐D) Images depicted details in the nuclear membrane completeness and cellular contents, and the hollow red arrowheads point to the nuclear debris. (E‐G) Images and analysis show mitochondrial structural details inside neurons, n = 335 mitochondria from ten neurons in the sham group, n = 161 mitochondria from ten neurons in the ischemic group, and blue arrowheads pointed the damaged mitochondria. (H‐J) Images and analysis of the synaptic and mitochondrial density. Red arrowheads point to synapses and blue arrowheads point to mitochondria. ***P < .001 and ****P = .0001, compared with the sham‐operated group
